Fig. 18
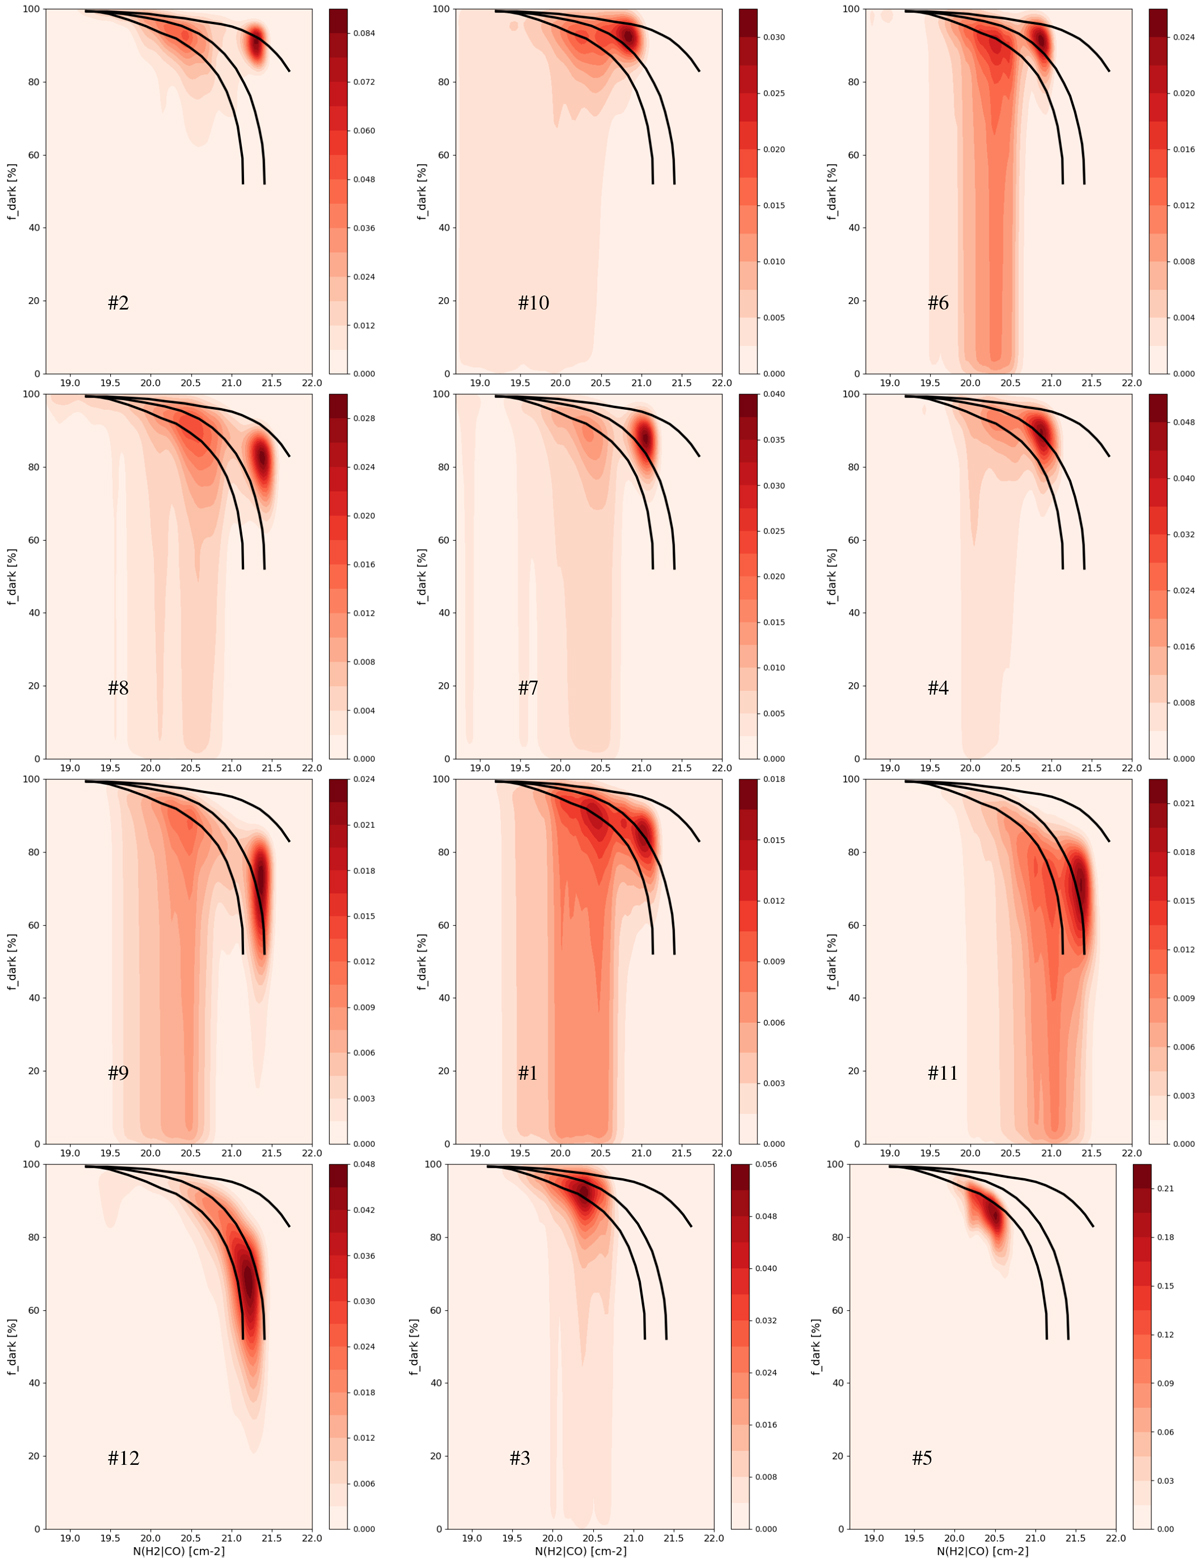
Bivariate kernel density estimate of the fraction of CO-dark H2 gas vs. the H2 column density measured from CO (i.e., ignoring CO-dark H2 gas) for all pointings. The shade scales with the density of points. The black curves serve as guides to compare the location of the probability peaks in different pointings. Plots are ordered according to the location of the main peak with respect to the black curves.
Current usage metrics show cumulative count of Article Views (full-text article views including HTML views, PDF and ePub downloads, according to the available data) and Abstracts Views on Vision4Press platform.
Data correspond to usage on the plateform after 2015. The current usage metrics is available 48-96 hours after online publication and is updated daily on week days.
Initial download of the metrics may take a while.