Open Access
Fig. 20
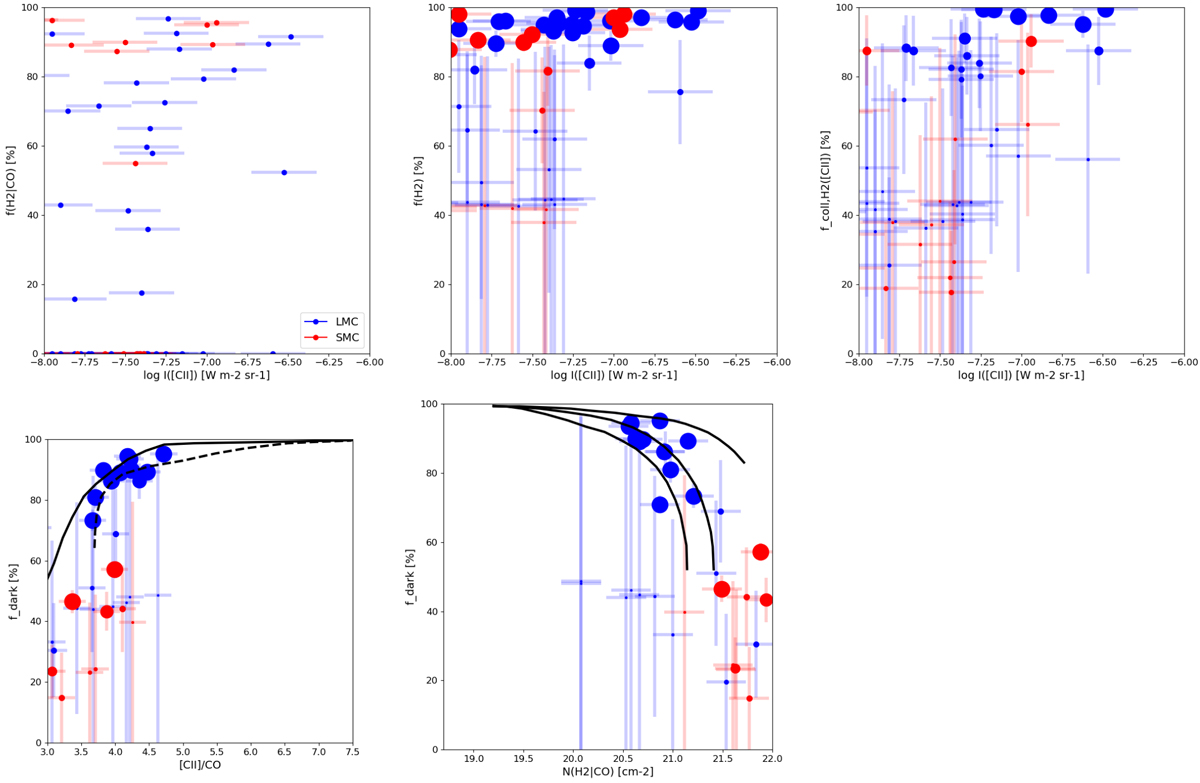
Results from Pineda et al. (2017) for LMC (blue) and SMC (red) regions. The symbol size is inversely proportional to the error bar of the y-axis parameter. The curves are the same as in Figures. 11 and 18.
Current usage metrics show cumulative count of Article Views (full-text article views including HTML views, PDF and ePub downloads, according to the available data) and Abstracts Views on Vision4Press platform.
Data correspond to usage on the plateform after 2015. The current usage metrics is available 48-96 hours after online publication and is updated daily on week days.
Initial download of the metrics may take a while.