Fig. 4
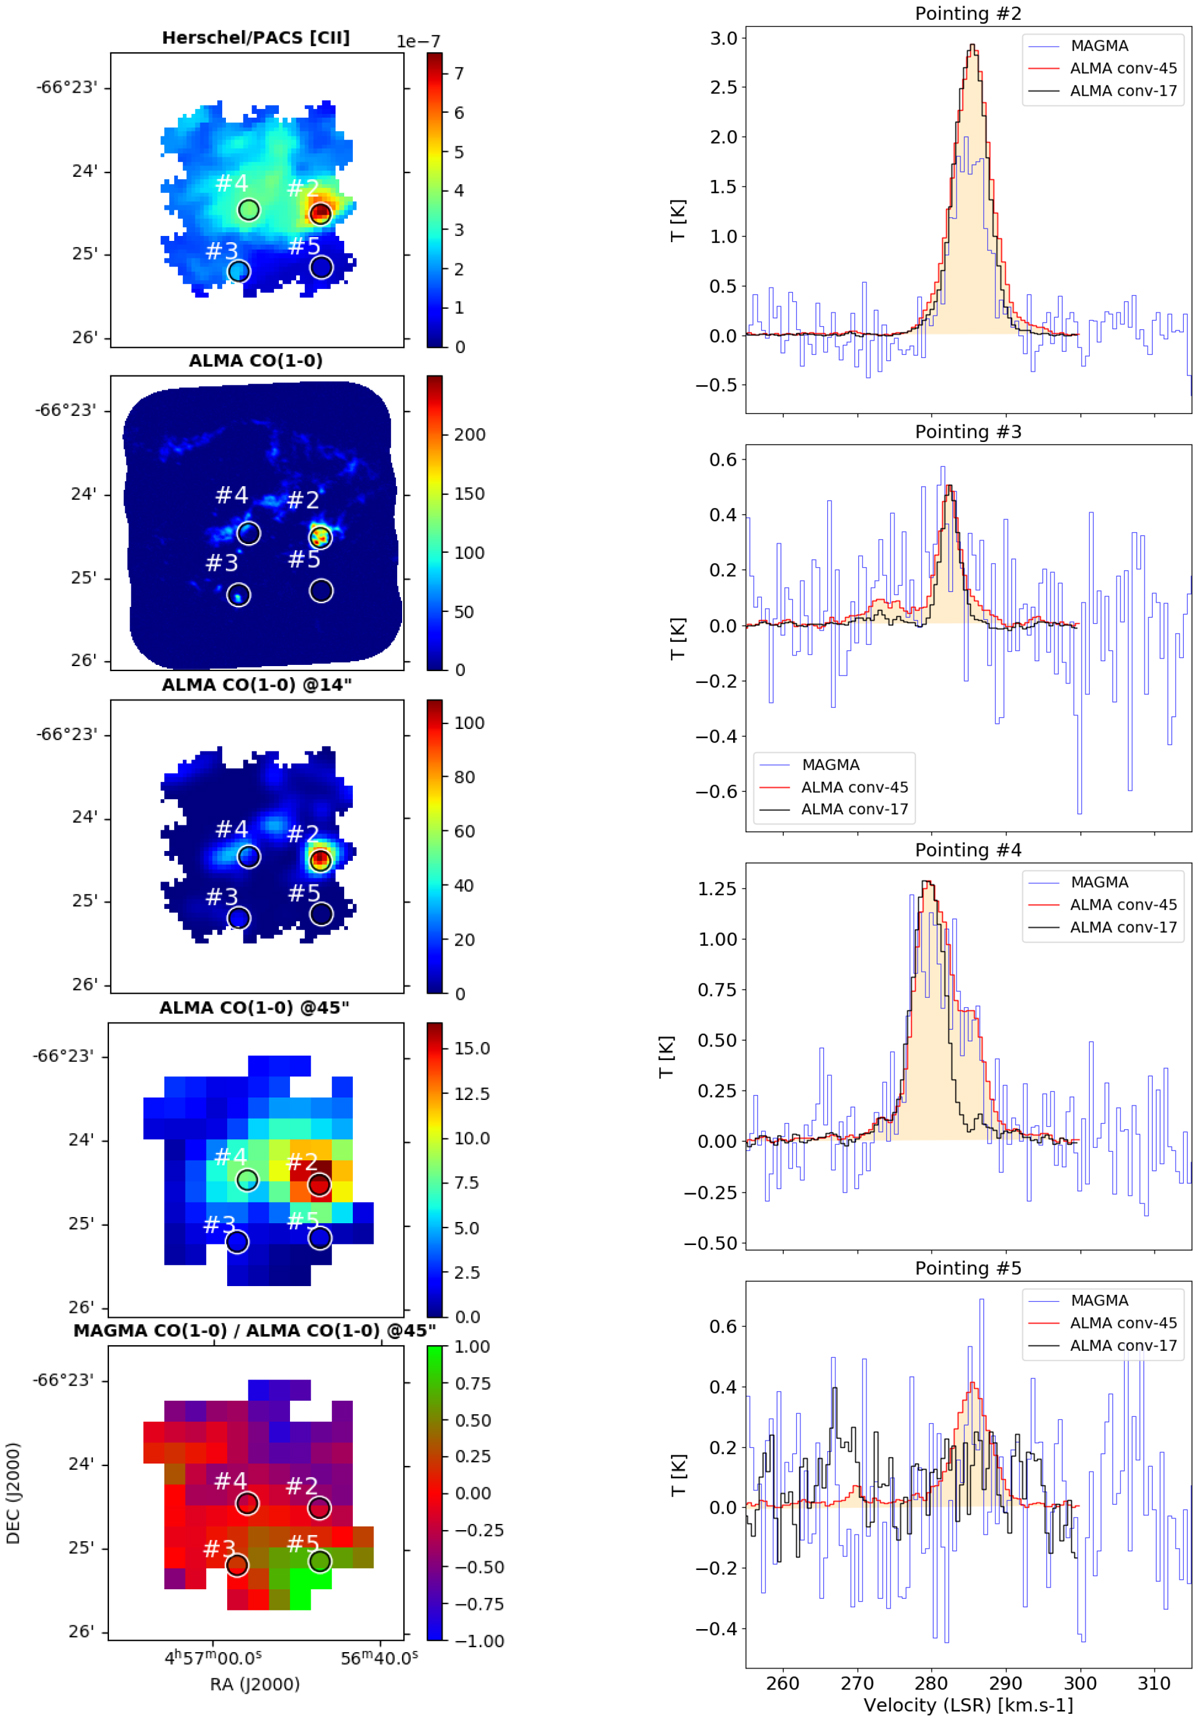
Comparison between ALMA, MAGMA, and Herschel data. Left column, from top to bottom: Herschel/PACS [C II] map of N 11B, the ALMA CO(1–0) map (original resolution, convolved to 14.4′′ and projected on PACS [C II] grid, and convolved to 45′′ and projected on MAGMA grid), and the ratio (log units) of CO MAGMA/ALMA. The GREAT pointings are overlaid as 14.4′′ diameter circles. Right column: MAGMA spectrum (blue histogram) and the ALMA spectra calculated for a 45′′ resolution (red with shade) and 17′′ resolution (black) for the four pointings in N 11B.
Current usage metrics show cumulative count of Article Views (full-text article views including HTML views, PDF and ePub downloads, according to the available data) and Abstracts Views on Vision4Press platform.
Data correspond to usage on the plateform after 2015. The current usage metrics is available 48-96 hours after online publication and is updated daily on week days.
Initial download of the metrics may take a while.