Fig. 5
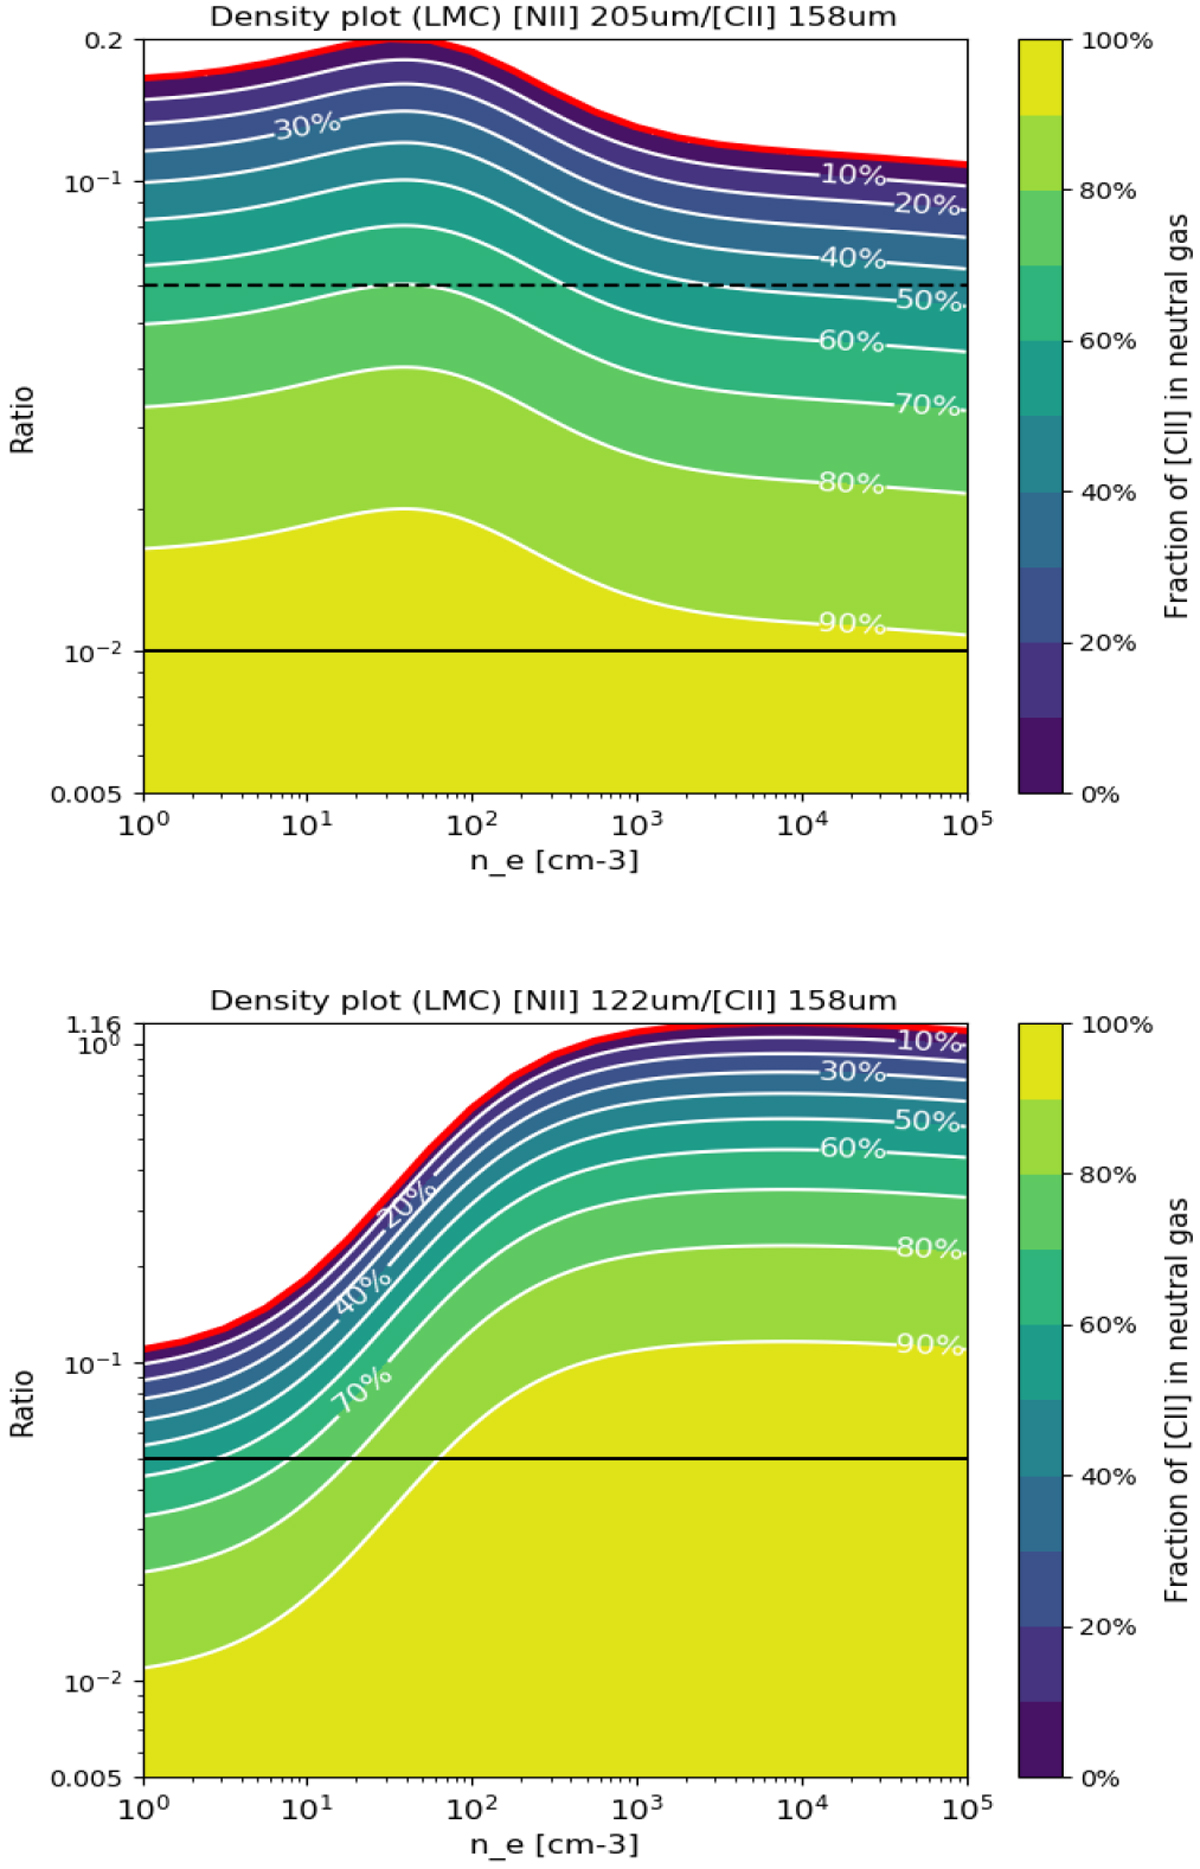
Theoretical [N II]/[C II] ratios as a function of density. The ratio values include ionic abundance ionization corrections (see text). The red curve indicates ratio values with [C II] originating fully in the ionized gas. The solid black lines show the observed upper limits for all pointings observed with Herschel/PACS (except #5 for [N II] 205μm/[C II] shown as a dashed line).
Current usage metrics show cumulative count of Article Views (full-text article views including HTML views, PDF and ePub downloads, according to the available data) and Abstracts Views on Vision4Press platform.
Data correspond to usage on the plateform after 2015. The current usage metrics is available 48-96 hours after online publication and is updated daily on week days.
Initial download of the metrics may take a while.