Fig. 6
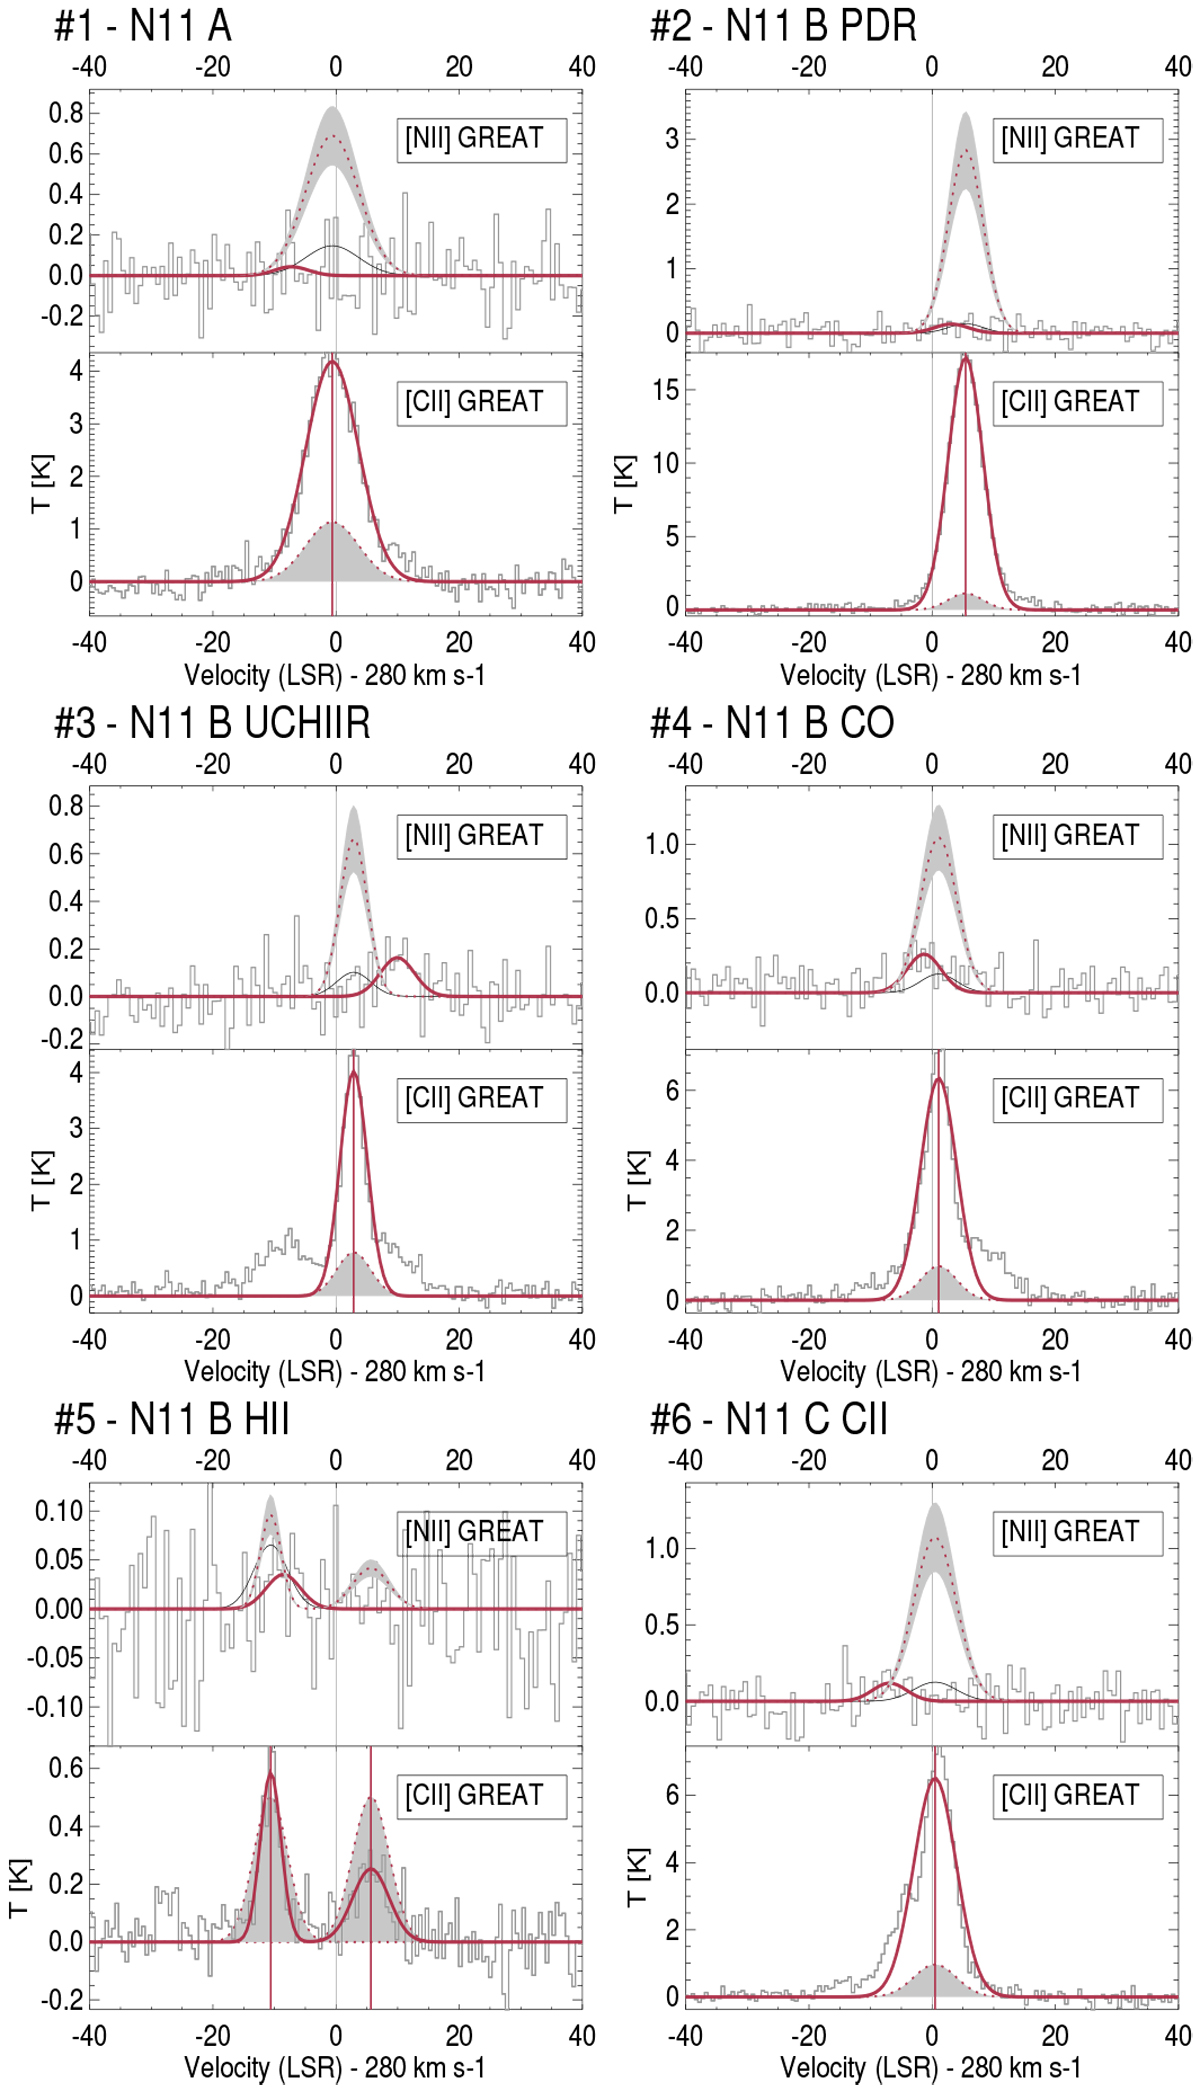
Comparison of the GREAT [N II] and [C II] spectral profiles for the six pointings with [N II] observations. The red solid curve shows for both lines the Gaussian fit to the main velocity components as in Fig. 2. For the [N II] spectrum the black curve corresponds to the rms flux while the red dotted curve shows the expected [N II] profile assuming [C II] arises only from the ionized gas, with the uncertainty shown as the gray area (see text). For the [C II] spectrum the red dotted curve and shaded area show the profile of [C II] in the ionized gas calculated using the [N II] rms (i.e., the brightest possible [C II] component arising from the ionized gas).
Current usage metrics show cumulative count of Article Views (full-text article views including HTML views, PDF and ePub downloads, according to the available data) and Abstracts Views on Vision4Press platform.
Data correspond to usage on the plateform after 2015. The current usage metrics is available 48-96 hours after online publication and is updated daily on week days.
Initial download of the metrics may take a while.