Fig. 7
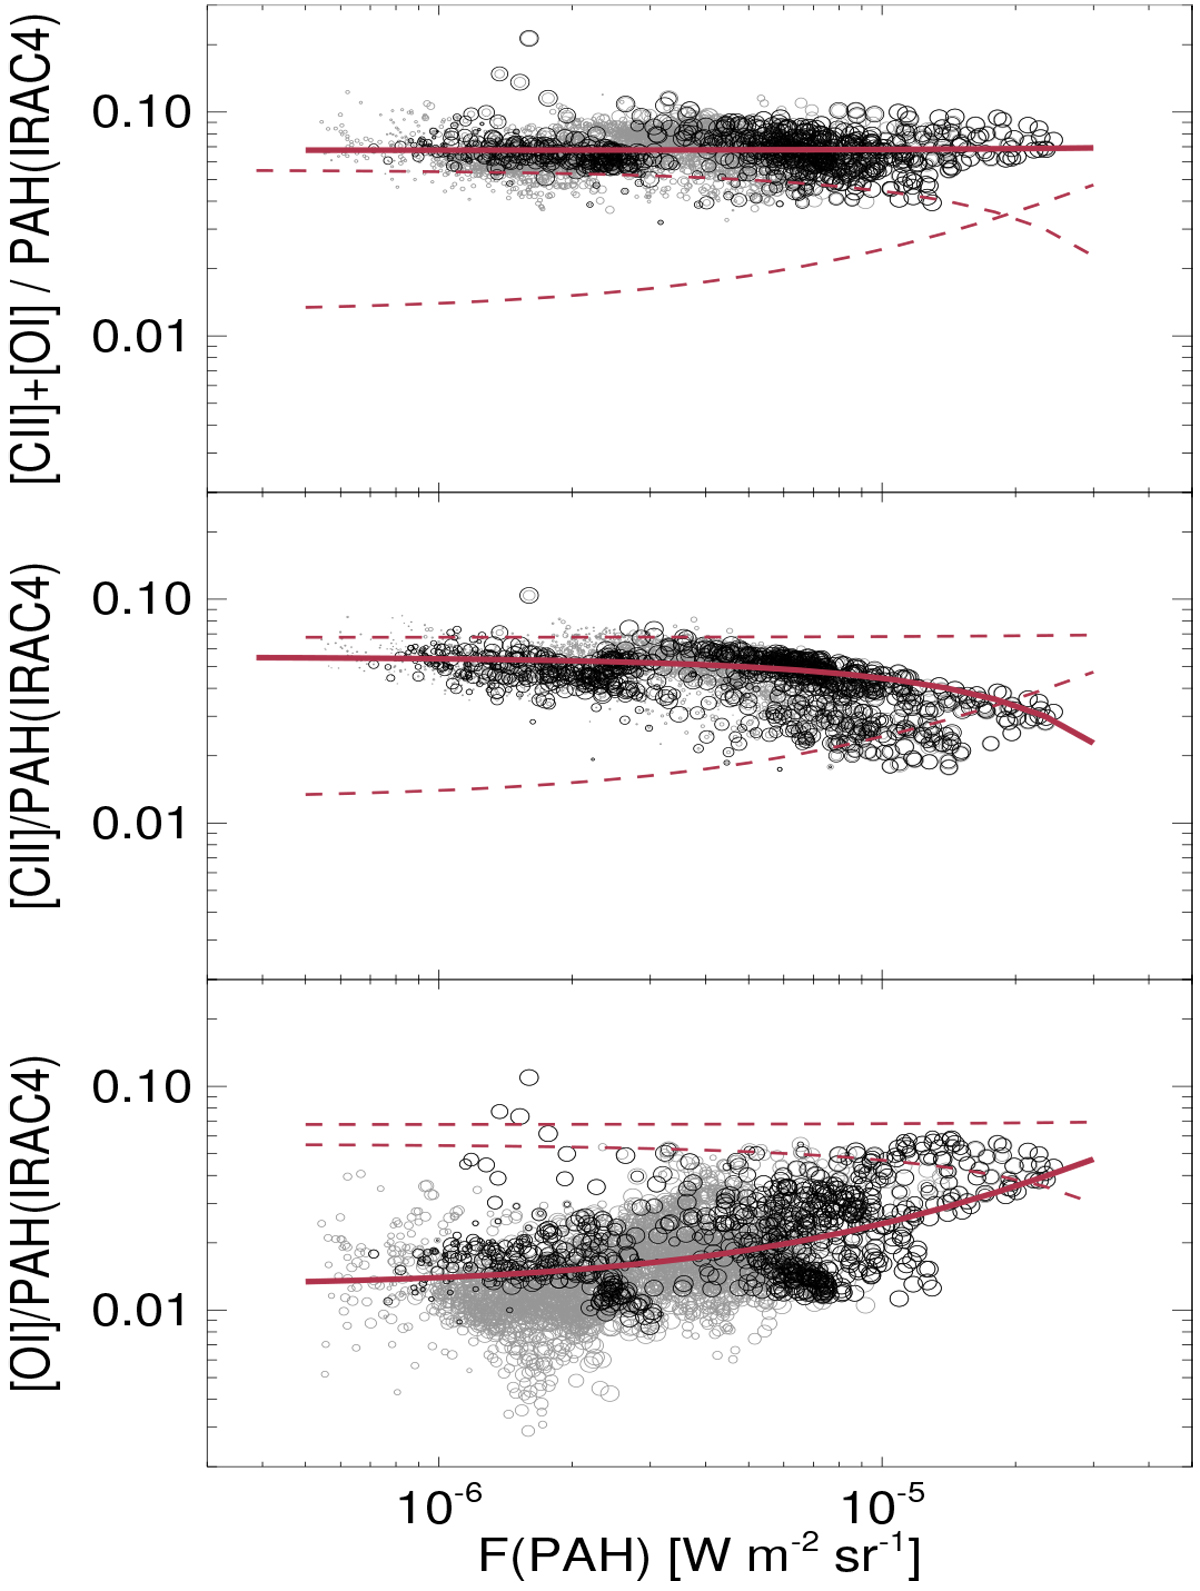
Variation of [O I]/PAH (bottom), [C II]/PAH (middle), and ([C II]+[O I])/PAH (top) across the regions in LMC-N 11 mapped with PACS. The size of the symbol scales with the signal-to-noise ratio. Black circles correspond to GREAT pointings. The solid line shows the linear regression for the corresponding ratio while the dashed lines show the regression obtained for the two other ratios.
Current usage metrics show cumulative count of Article Views (full-text article views including HTML views, PDF and ePub downloads, according to the available data) and Abstracts Views on Vision4Press platform.
Data correspond to usage on the plateform after 2015. The current usage metrics is available 48-96 hours after online publication and is updated daily on week days.
Initial download of the metrics may take a while.