Fig. 8
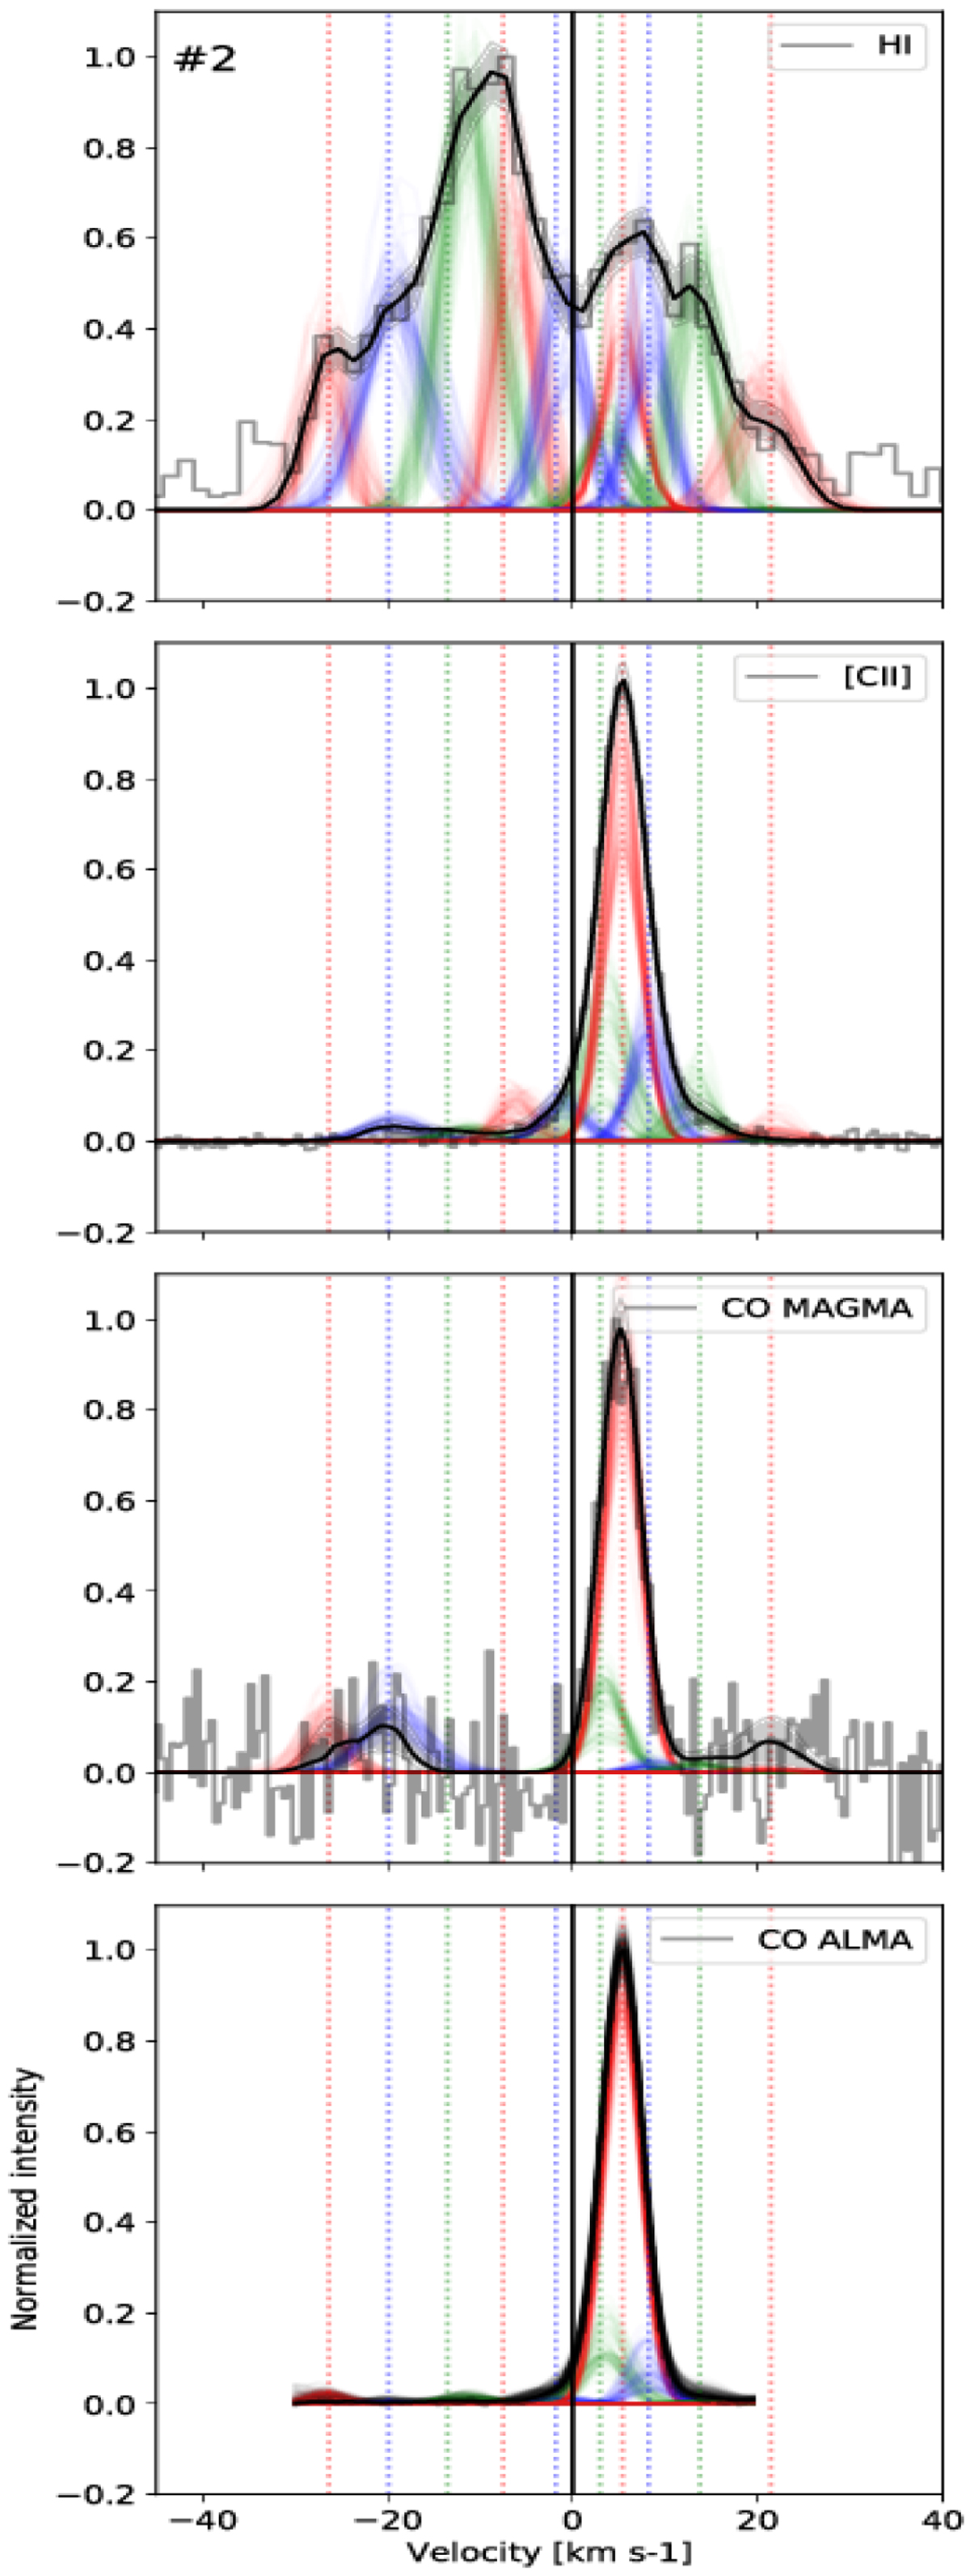
Illustration of the profile decomposition method for pointing #2 for one of the model input parameter sets (Nc = 10; σmin = 1 km s−1; Δvmin = 1 km s−1). The gray histogram shows the data. The red, green, and dark blue curves correspond to different components and the dotted vertical line shows the velocity for each component. The black solid curve shows the total inferred profile.
Current usage metrics show cumulative count of Article Views (full-text article views including HTML views, PDF and ePub downloads, according to the available data) and Abstracts Views on Vision4Press platform.
Data correspond to usage on the plateform after 2015. The current usage metrics is available 48-96 hours after online publication and is updated daily on week days.
Initial download of the metrics may take a while.