Fig. 3
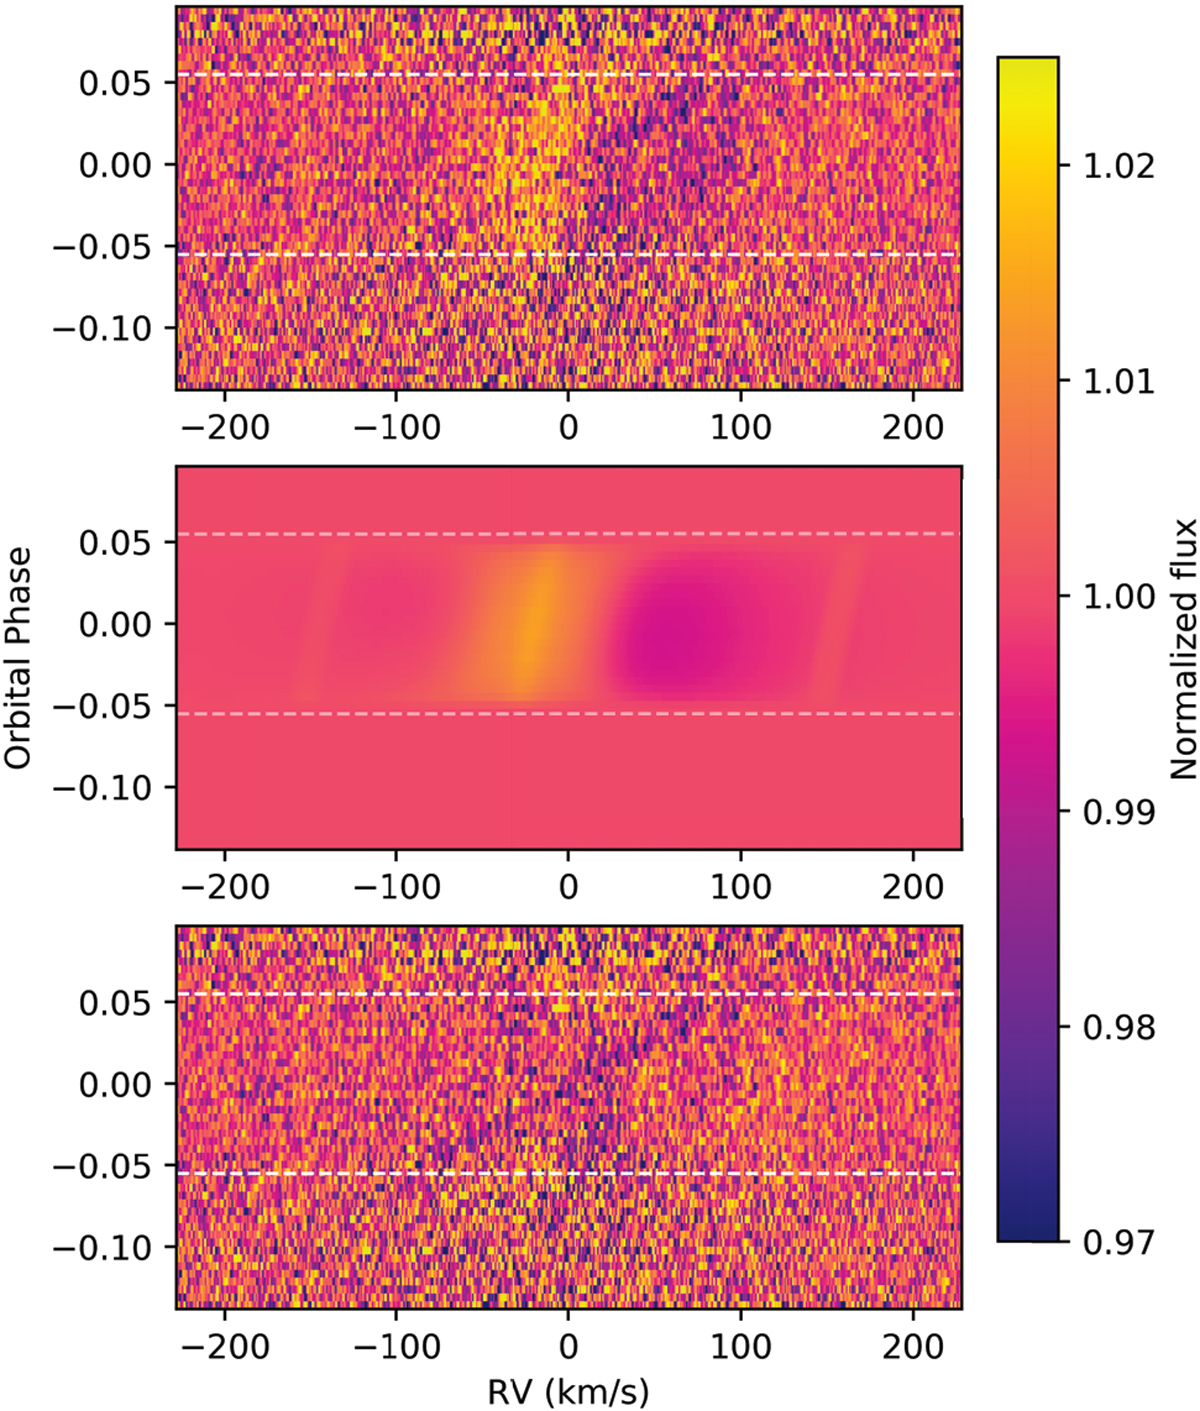
RM +CLV effects of the Ca II K 3933.66 Å line for KELT-9b. Upper panel: observed transmission spectral matrix. Middle panel: simulated stellar line profile changes due to the RM + CLV effects with an f factor f = 2.1 (see text). Separate models of the CLV effect and RM effect are presented in Fig. 2. Bottom panel: transmission spectrum after the correction of the RM + CLV effects. The white horizontal lines label ingress and egress. The obvious shadow with a RV drift from −90 km s−1 at ingress to +90 km s−1 at egress is the planetary absorption.
Current usage metrics show cumulative count of Article Views (full-text article views including HTML views, PDF and ePub downloads, according to the available data) and Abstracts Views on Vision4Press platform.
Data correspond to usage on the plateform after 2015. The current usage metrics is available 48-96 hours after online publication and is updated daily on week days.
Initial download of the metrics may take a while.