Fig. 3.
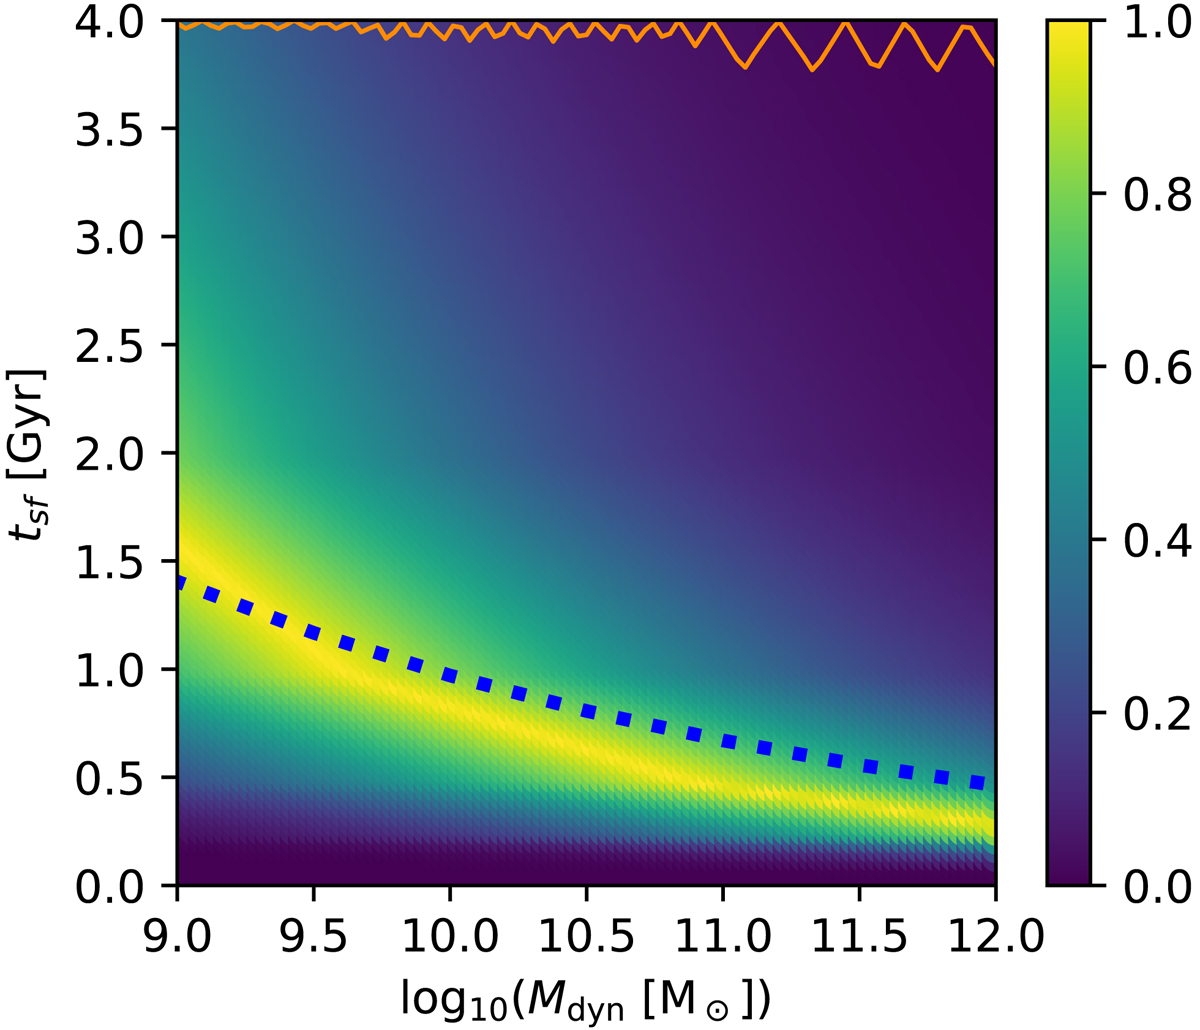
Likelihood (shown as the colour map) for a given SFT, tsf, and galaxy dynamical mass, Mdyn, as defined in Eq. (4) assuming an invariant canonical gwIMF and fitting only the [Mg/Fe] observations. The blue dotted curve indicates the downsizing relation of Thomas et al. (2005). The thin orange curve is the value of the highest likelihood for any given Mdyn that follows the yellow ridge-line, sharing the y-axis with the likelihood colour-bar.
Current usage metrics show cumulative count of Article Views (full-text article views including HTML views, PDF and ePub downloads, according to the available data) and Abstracts Views on Vision4Press platform.
Data correspond to usage on the plateform after 2015. The current usage metrics is available 48-96 hours after online publication and is updated daily on week days.
Initial download of the metrics may take a while.