Fig. 7.
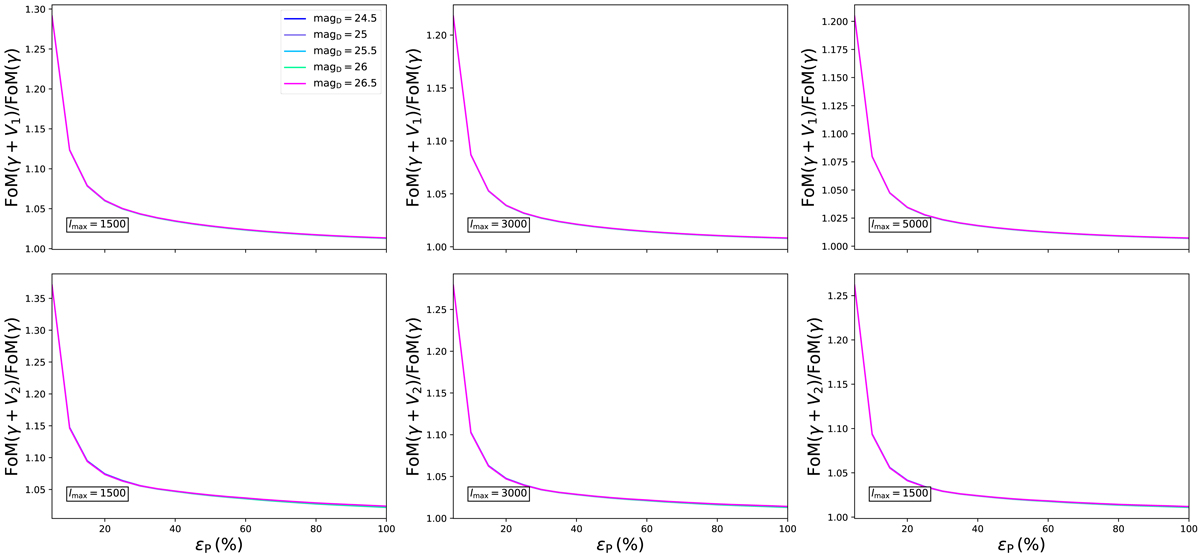
Top: FoM ratio as function of the prior εP on the MFs nuisance parameters for different values of the limiting magnitude magD of the deep survey when V1 alone is added to the shear tomography with ℓmax = (1500, 3000, 5000) from left to right. Bottom: same as in the top panel, but for V2 alone added to the shear. In each panel the curves for different magD are so superimposed that they cannot be seen at all.
Current usage metrics show cumulative count of Article Views (full-text article views including HTML views, PDF and ePub downloads, according to the available data) and Abstracts Views on Vision4Press platform.
Data correspond to usage on the plateform after 2015. The current usage metrics is available 48-96 hours after online publication and is updated daily on week days.
Initial download of the metrics may take a while.