Fig. 8.
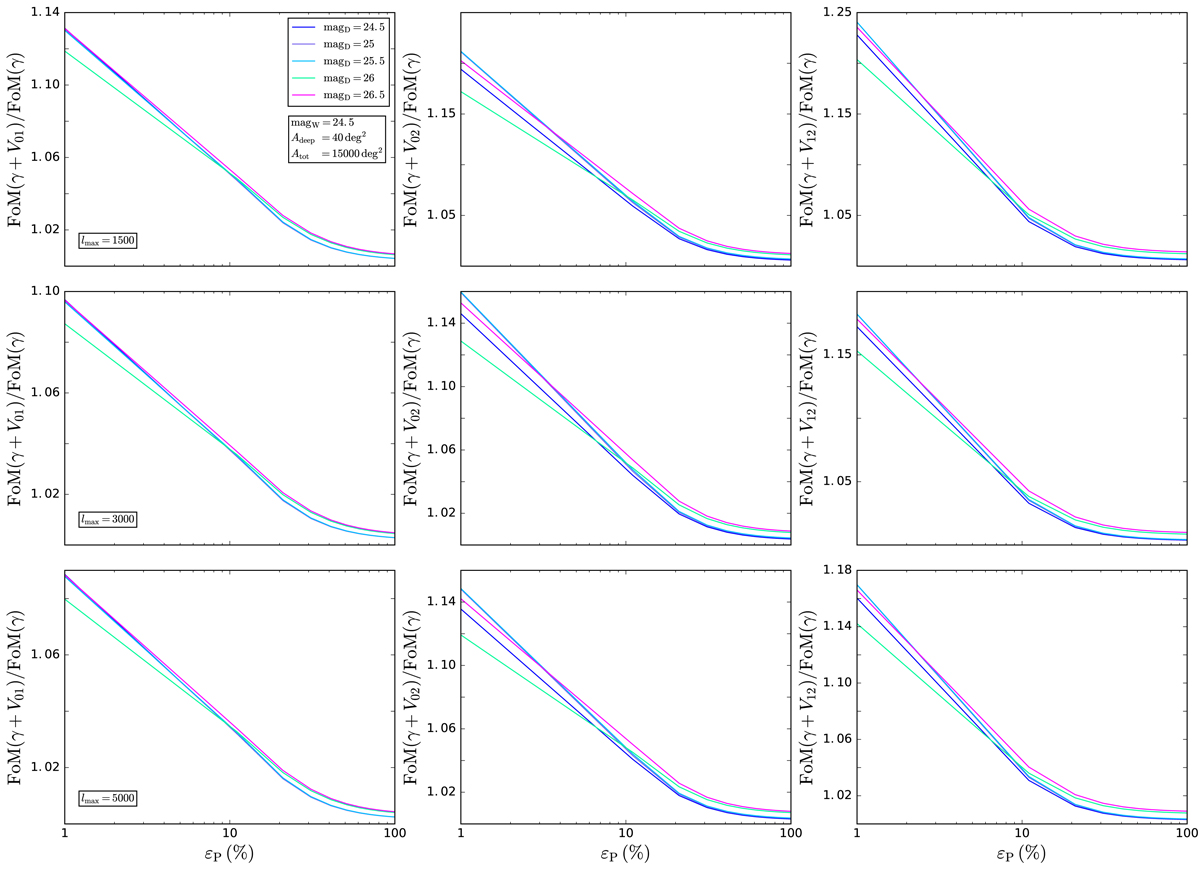
Same as Fig. 7, but adding two MFs to shear tomography V01, V02, and V12 for the left, center, and right panels. Again, the dependence on magD is hard to appreciate, so that for most of the panels, it is impossible to see more than one curve. The only exception is the line referring to magD = 26.0 in the bottom panels. We plot here a smaller εP range to better show the behavior over the range for which adding MFs to the shear tomography indeed helps increasing the FoM by a significant amount.
Current usage metrics show cumulative count of Article Views (full-text article views including HTML views, PDF and ePub downloads, according to the available data) and Abstracts Views on Vision4Press platform.
Data correspond to usage on the plateform after 2015. The current usage metrics is available 48-96 hours after online publication and is updated daily on week days.
Initial download of the metrics may take a while.