Fig. 12.
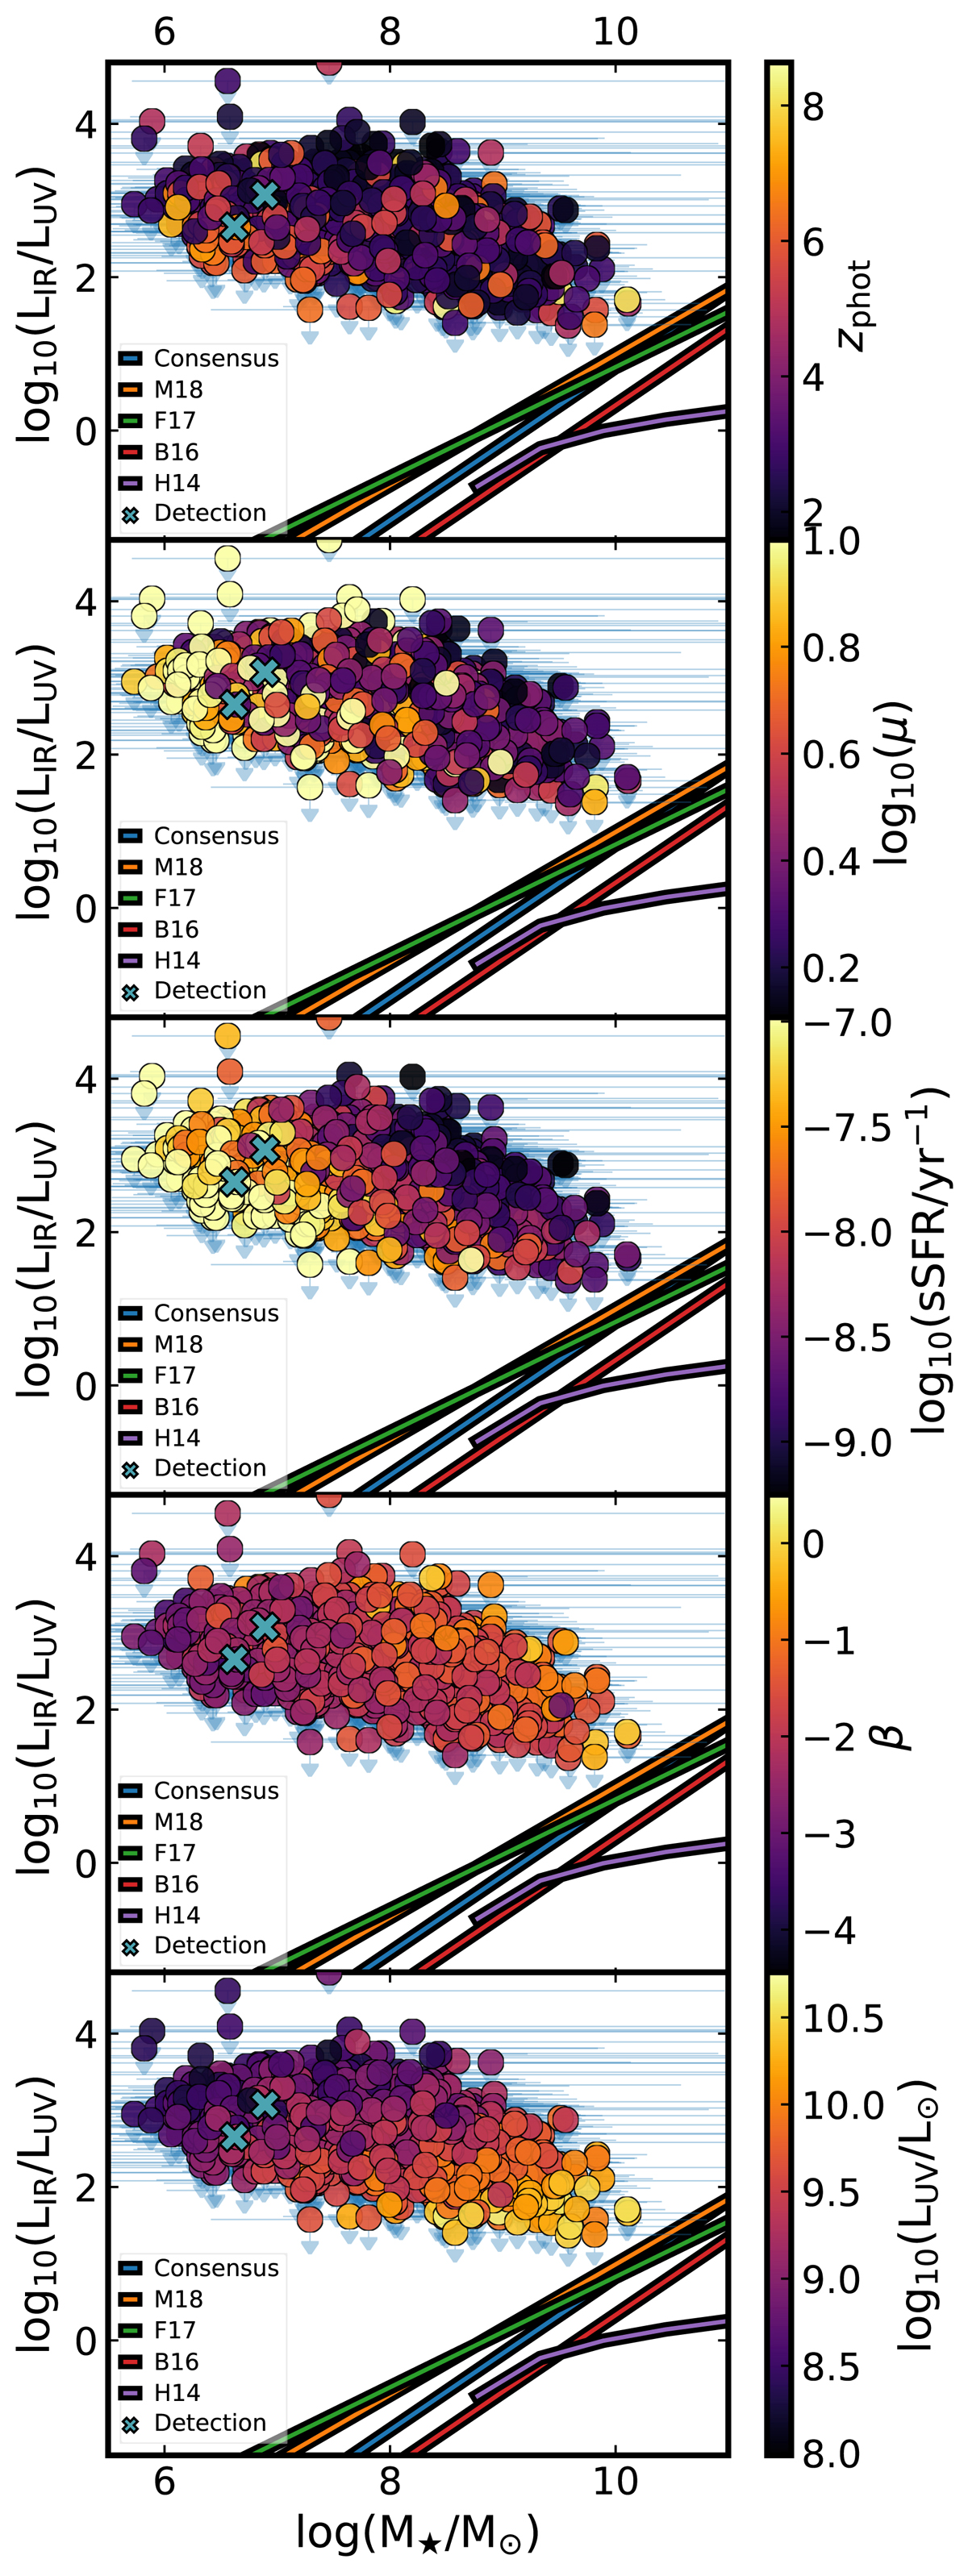
Comparison of infrared excess (IRX) 3-σ upper limits and stellar masses M⋆ for our LBG candidates. Downward arrows have 1-σ length. From top to bottom panels: colors represent: photometric redshift (zph), magnification factor (μ), star formation rate (SFR), UV slope (β) and UV Luminosity (LUV). Local IRX–M⋆ relations presented in Sect. 2.13 are shown for reference. Blue crosses represent the two detections.
Current usage metrics show cumulative count of Article Views (full-text article views including HTML views, PDF and ePub downloads, according to the available data) and Abstracts Views on Vision4Press platform.
Data correspond to usage on the plateform after 2015. The current usage metrics is available 48-96 hours after online publication and is updated daily on week days.
Initial download of the metrics may take a while.