Fig. 15.
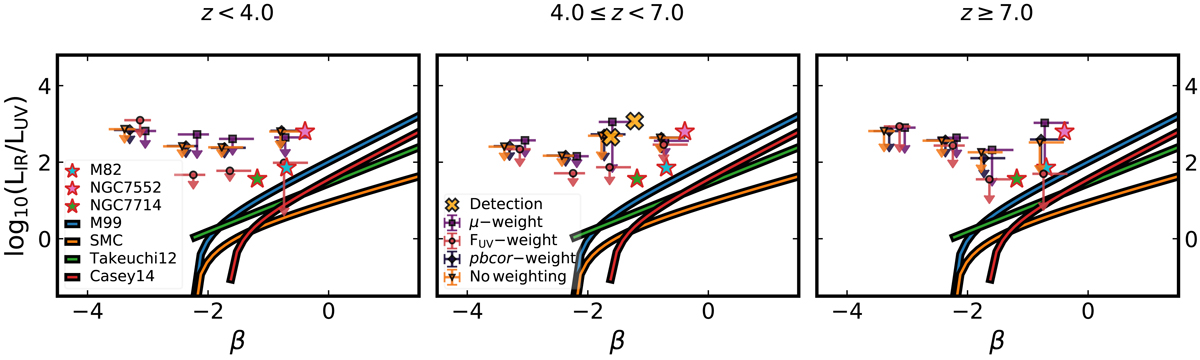
Stacked observed infrared-excess (IRX) 3-σ limits as a function of UV-slope (β). For each β bin, the weighted median IRX upper limit is shown (orange triangles for equal weighting, black diamonds for pbcor-weighting, purple squares for magnification-weighting, and light rose circles for UV flux weighting; see Sect. 3.2). Results are separated into three photometric redshift bins all of which are upper limits. For comparison, we also show the local IRX–β relations (B16, SMC, Smit et al. 2016; Takeuchi et al. 2012; Casey et al. 2014) and the locations of three well-known local star-forming galaxies (M 82, NGC 7552 and NGC 7714). The downward arrows have 1-σ length. Horizontal errorbars indicate the 16th and 84th percentiles of the distribution of LBG candidates for each UV-slope bin. Yellow crosses show the two individual ALMA detections.
Current usage metrics show cumulative count of Article Views (full-text article views including HTML views, PDF and ePub downloads, according to the available data) and Abstracts Views on Vision4Press platform.
Data correspond to usage on the plateform after 2015. The current usage metrics is available 48-96 hours after online publication and is updated daily on week days.
Initial download of the metrics may take a while.