Fig. 17.
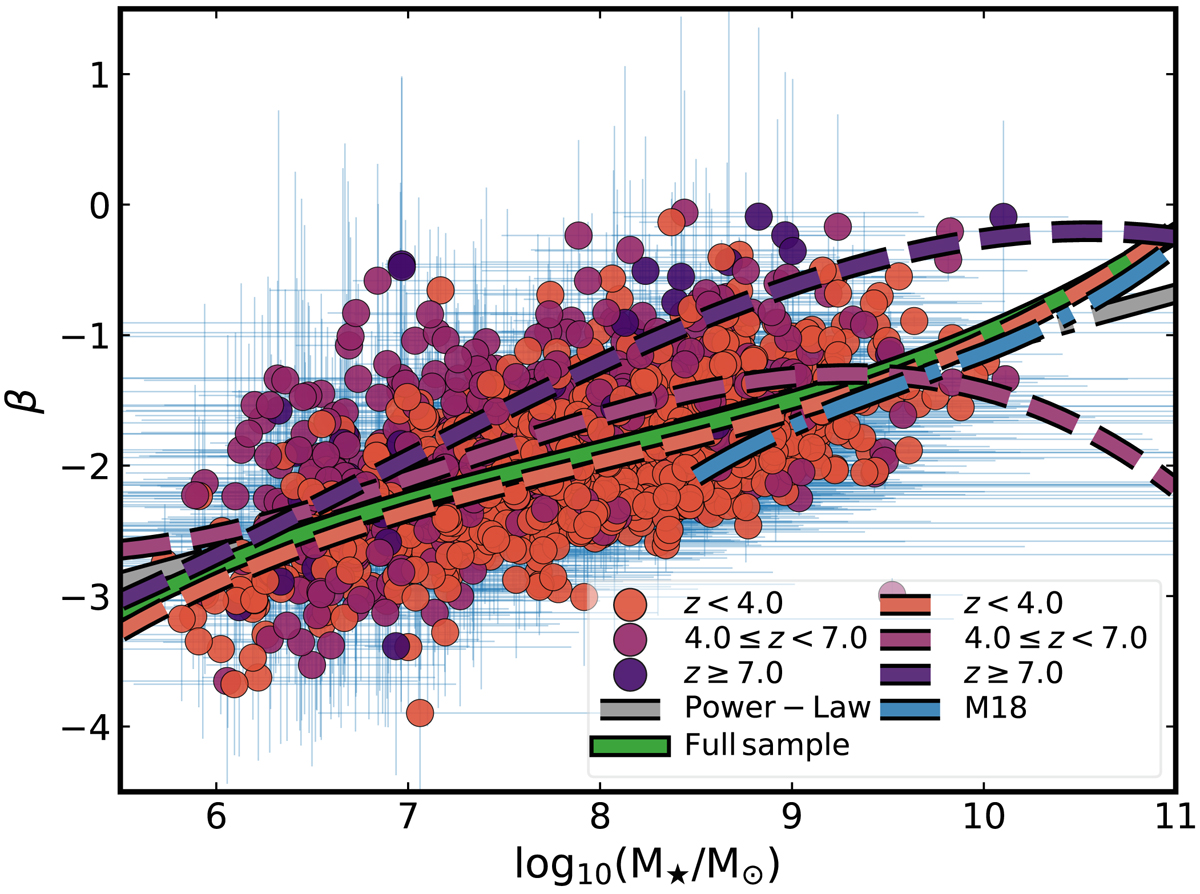
UV-slope (β) vs. stellar mass (M⋆) for our selected LBG candidates. Colors represent our three photometric redshift bins (both point and polynomial fitting lines). Blue dashed line represents fit from M18 for their sample with stellar masses log(M⋆/M⊙) ≥ 8.5 and green solid line shows our third-order polynomial fit (Eq. (18)). We also include the first-order polynomial from Eq. (19) in gray.
Current usage metrics show cumulative count of Article Views (full-text article views including HTML views, PDF and ePub downloads, according to the available data) and Abstracts Views on Vision4Press platform.
Data correspond to usage on the plateform after 2015. The current usage metrics is available 48-96 hours after online publication and is updated daily on week days.
Initial download of the metrics may take a while.