Fig. 5.
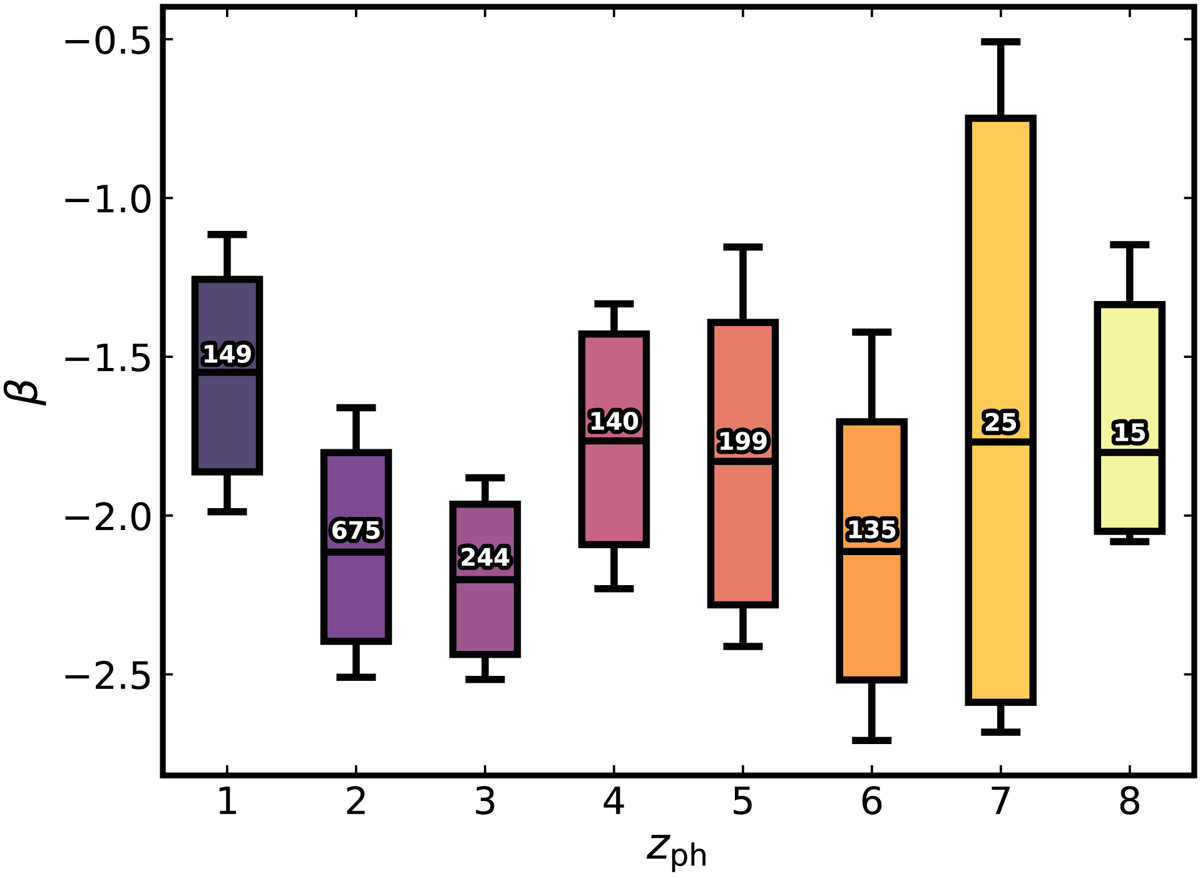
Distribution of β values according to photometric redshift. Heights of boxes represent the 25% and 75% quartiles of the data. Horizontal lines inside the box indicate the median value for each redshift bin. Vertical error bars span the central 2-σ of the data. Numbers above the median in each box state the number of LBG candidates assigned to each bin. Even though there is not a zph ∼ 4 band from drop-out selection, there are candidates in that bin.
Current usage metrics show cumulative count of Article Views (full-text article views including HTML views, PDF and ePub downloads, according to the available data) and Abstracts Views on Vision4Press platform.
Data correspond to usage on the plateform after 2015. The current usage metrics is available 48-96 hours after online publication and is updated daily on week days.
Initial download of the metrics may take a while.