Fig. 8.
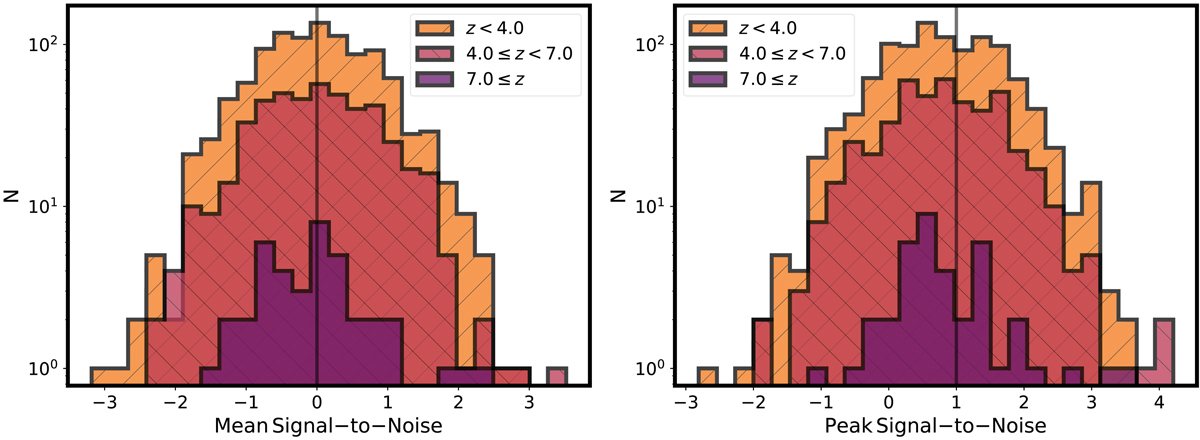
Mean (left) and peak (right) signal-to-noise ratios (S/N) for our candidates in the ALMA maps. The LBG candidates are separated into three photometric redshift sub-samples, represented by distinct colors. The mean value is centered around S/N ∼ 0 (vertical dark line) and is roughly Gaussian. The peak values are centered around S/N ∼ 1, rather than S/N ∼ 0 (vertical dark line), due to the selection of the peak pixel which arises within half a beamwidth; this conservatively biases the maximum flux associated with a candidate to higher values.
Current usage metrics show cumulative count of Article Views (full-text article views including HTML views, PDF and ePub downloads, according to the available data) and Abstracts Views on Vision4Press platform.
Data correspond to usage on the plateform after 2015. The current usage metrics is available 48-96 hours after online publication and is updated daily on week days.
Initial download of the metrics may take a while.