Fig. 5
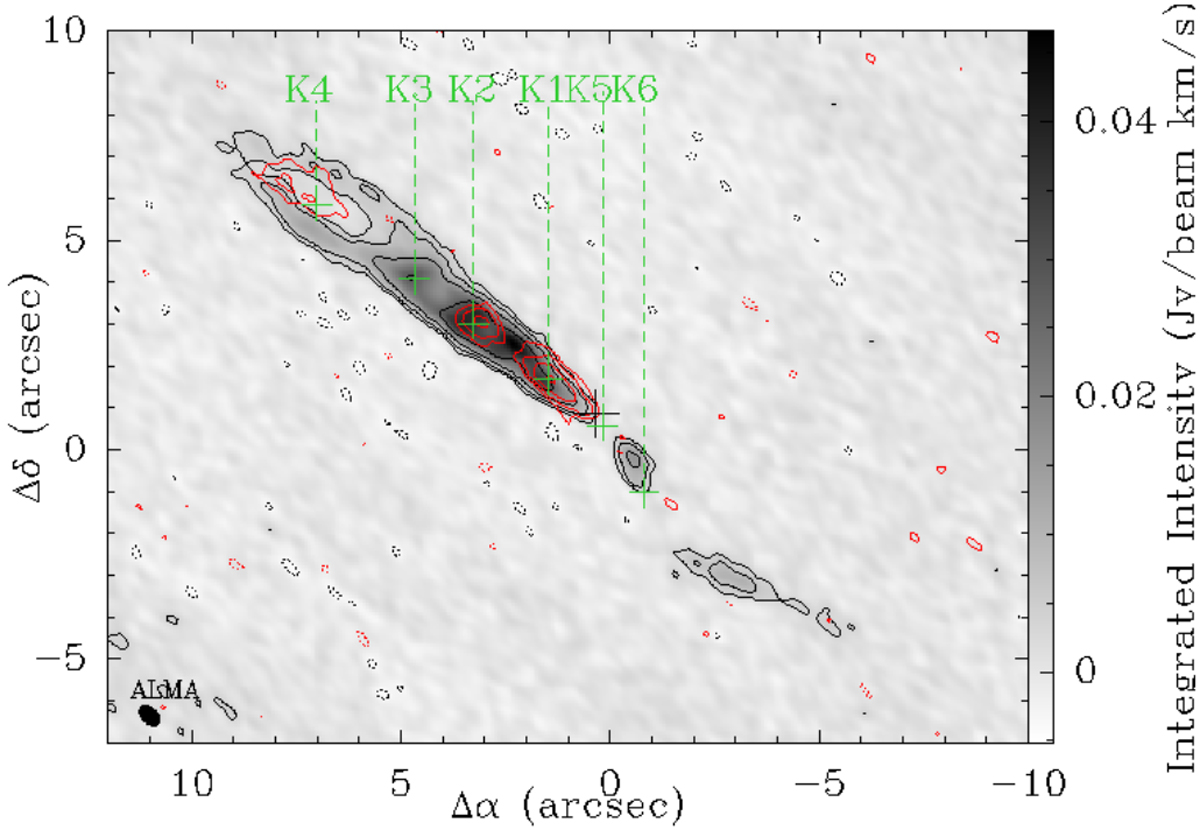
Integrated intensity maps toward Cha-MMS1 (black cross) of the high-velocity redshifted CO 3–2 gas [15.0, 21.8] km s−1 shown with red contours and the low-velocity redshifted CO 3–2 gas [9.1, 11.6] km s−1 shown in grayscale and with black contours. The contour levels are − 3σ, 3σ, 6σ, 12σ, and 24σ with σ = 0.7 mJy beam−1 km s−1 and 1.1 mJybeam−1 km s−1 for the emissions at high velocities and low velocities, respectively. The green crosses K1–K6 mark the positions at which the spectra in Figs. 3c–h were taken. The HPBW is shown in the bottom left corner. The black cross marks the position of the continuum peak.
Current usage metrics show cumulative count of Article Views (full-text article views including HTML views, PDF and ePub downloads, according to the available data) and Abstracts Views on Vision4Press platform.
Data correspond to usage on the plateform after 2015. The current usage metrics is available 48-96 hours after online publication and is updated daily on week days.
Initial download of the metrics may take a while.