Fig. 4
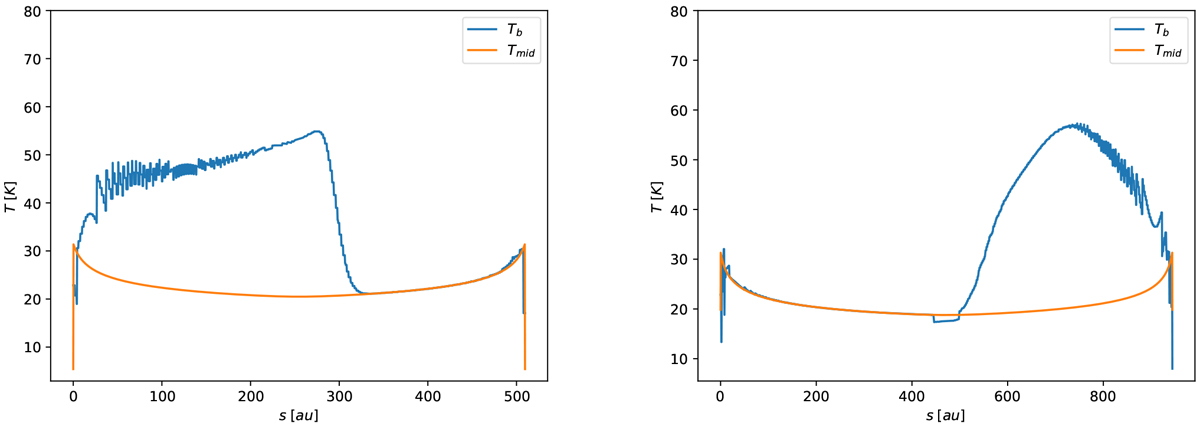
Brightness temperature (using the full Planck function) along the two paths shown in Fig. 3. Left: inner path. Right: outer path. Overplotted is the actual midplane temperature of the model. In the regions where the path passes through the part of the image where the darker midplane emission is visible, the match between the synthetic observation and the true gas temperature is nearly perfect, as expected. The deviation between the two curves elsewhere is due to the fact that the path passes through the much brighter surface layer emission.
Current usage metrics show cumulative count of Article Views (full-text article views including HTML views, PDF and ePub downloads, according to the available data) and Abstracts Views on Vision4Press platform.
Data correspond to usage on the plateform after 2015. The current usage metrics is available 48-96 hours after online publication and is updated daily on week days.
Initial download of the metrics may take a while.