Fig. A.2
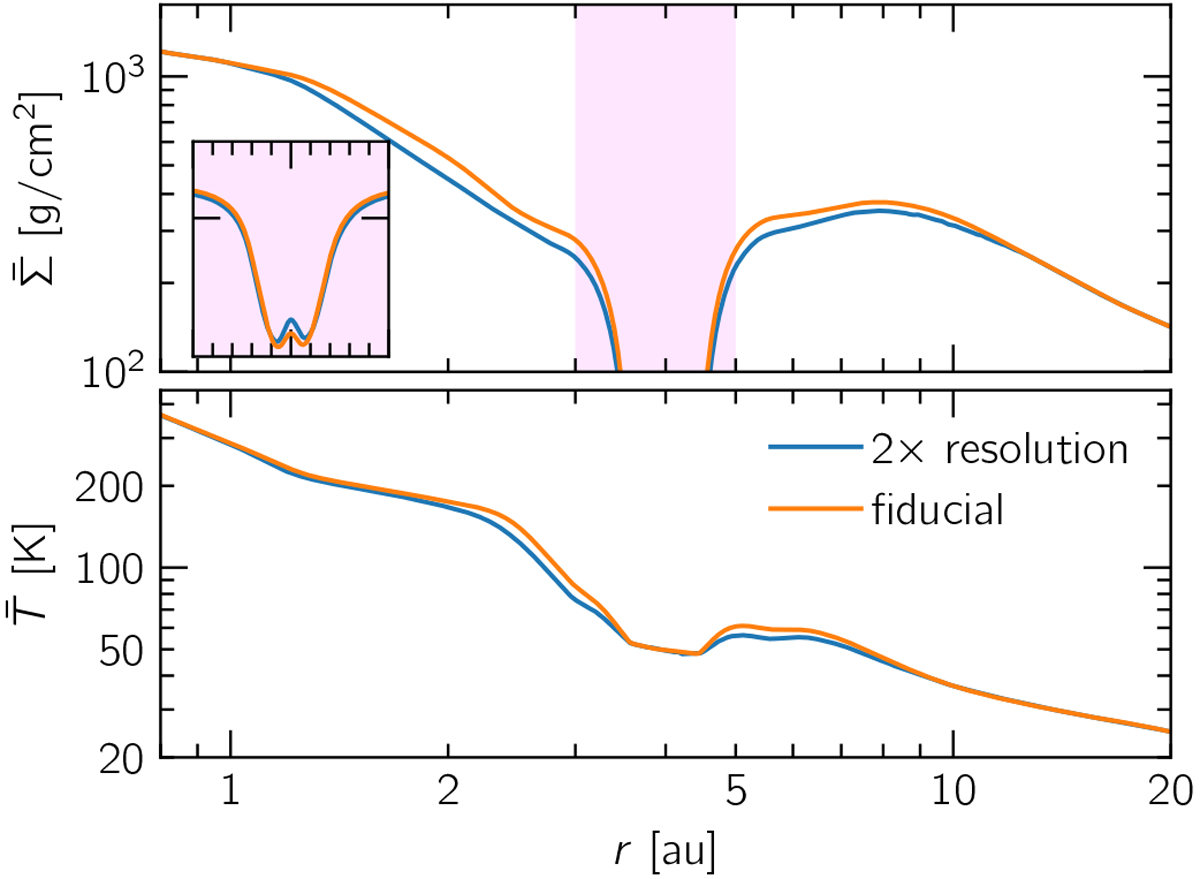
Two runs for our fiducial model, one of which (blue curves) has double resolution on both r and ϕ axes (for total of four times as many cells). The snapshots are taken at t = 100 kyr (12 500 orbits) where equilibrium has more or less been reached. The inset zooms in on the pink-tinted region, showcasing the match between the two gap profiles.
Current usage metrics show cumulative count of Article Views (full-text article views including HTML views, PDF and ePub downloads, according to the available data) and Abstracts Views on Vision4Press platform.
Data correspond to usage on the plateform after 2015. The current usage metrics is available 48-96 hours after online publication and is updated daily on week days.
Initial download of the metrics may take a while.