Free Access
Fig. 7
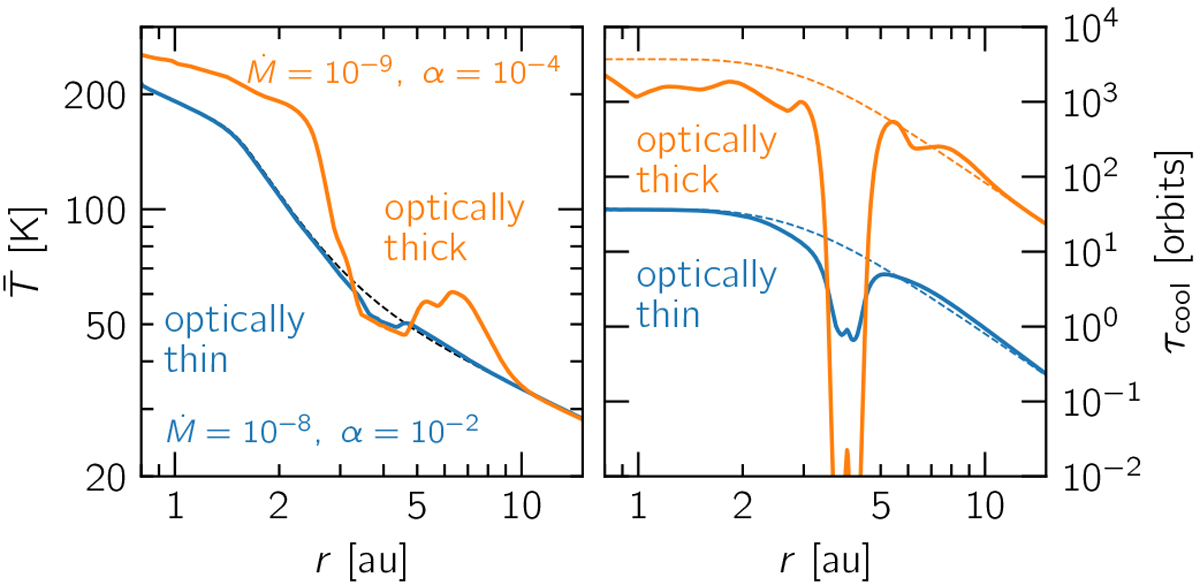
Azimuthally-averaged temperature and cooling timescale for two models that share the same initial temperature profile but have very different optical depth profiles. We see that shock heating is significantly stronger for the optically thicker model, while the optically thinner one looks almost unchanged.
Current usage metrics show cumulative count of Article Views (full-text article views including HTML views, PDF and ePub downloads, according to the available data) and Abstracts Views on Vision4Press platform.
Data correspond to usage on the plateform after 2015. The current usage metrics is available 48-96 hours after online publication and is updated daily on week days.
Initial download of the metrics may take a while.