Fig. 1.
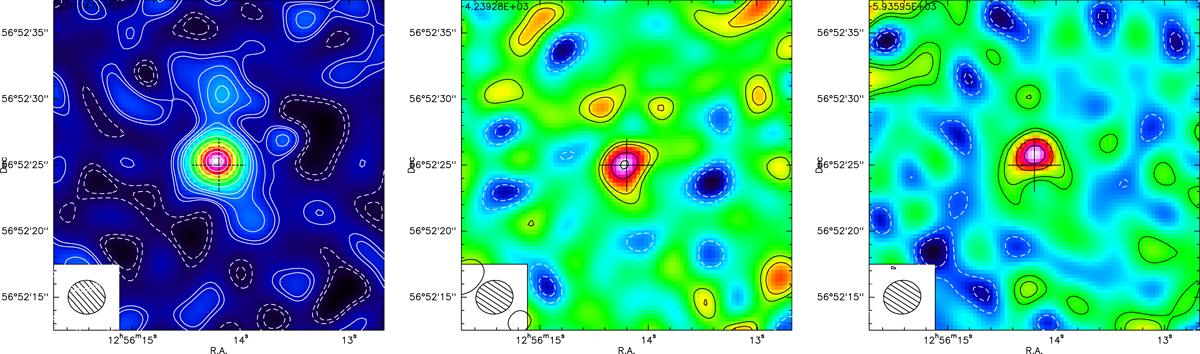
IRAM PdBI continuum-subtracted maps of the CN(1–0) line emission. From left to right: (i) total emission integrated between −800 < v [km s−1]< 1600, where velocities are calculated with respect to the J = 3/2−1/2 spingroup (Table 1); (ii) blue wing of the J = 3/2−1/2 line (−500 < v [km s−1]< − 300); (iii) red wing, integrated between 108.372 < νobs[GHz] < 108.463, corresponding to velocities 300 < v [km s−1]< 550 with respect to the central frequency of the fainter J = 1/2−1/2 spingroup (where the red line wing is not affected by blending). All maps are corrected for the primary beam (45.6″ FWHM) and show the central 25″ × 25″ region. The synthesised beam is reported in the bottom left corner of the maps. Negative contours (dashed lines) correspond to (−6σ, −3σ, −2σ), and positive contours (solid lines) correspond to (2σ, 3σ, 6σ, 9σ, n × 12σ), with n = 1, 2, etc., where σ is the rms of the cleaned datacube (see Table 1).
Current usage metrics show cumulative count of Article Views (full-text article views including HTML views, PDF and ePub downloads, according to the available data) and Abstracts Views on Vision4Press platform.
Data correspond to usage on the plateform after 2015. The current usage metrics is available 48-96 hours after online publication and is updated daily on week days.
Initial download of the metrics may take a while.