Fig. 5.
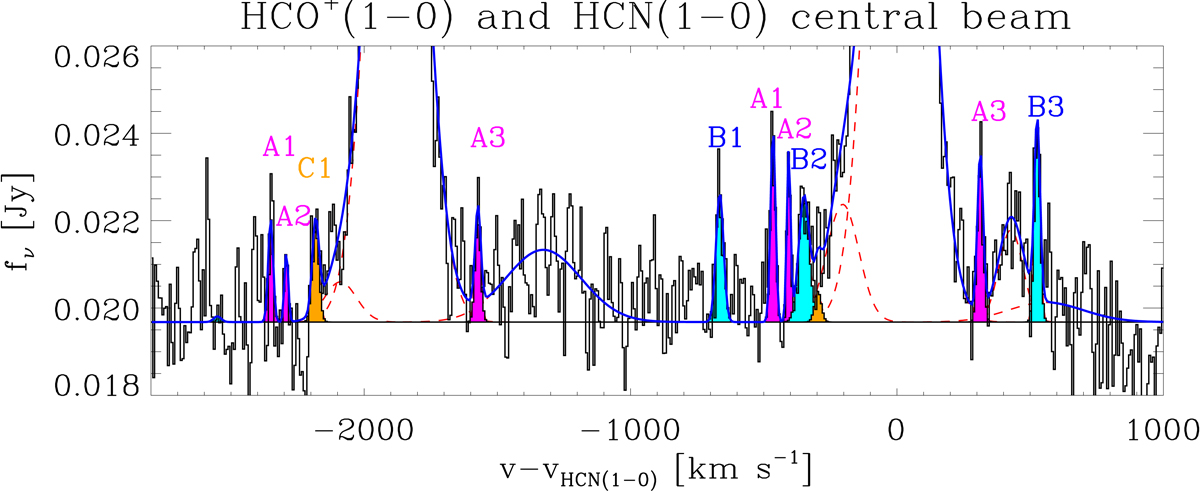
Spectral fit to the HCN(1–0) and HCO+(1–0) line wings showing several spectrally resolved narrow substructures (here often indicated as clumps). The spectrum was extracted from the cleaned datacube before continuum subtraction and using a beam-size aperture centred at RA(J2000) = 12:56:14.216 and Dec(J2000) = 56:52:25.186. The rms is 1.8 mJy per δv = 6.9 km s−1 spectral channel. The clump solutions that were simultaneously fitted to both transitions are plotted in magenta, and features detected only in HCN (HCO+) are shown in cyan (orange). The best-fit Gaussian parameters are reported in Table 3.
Current usage metrics show cumulative count of Article Views (full-text article views including HTML views, PDF and ePub downloads, according to the available data) and Abstracts Views on Vision4Press platform.
Data correspond to usage on the plateform after 2015. The current usage metrics is available 48-96 hours after online publication and is updated daily on week days.
Initial download of the metrics may take a while.