Fig. 11.
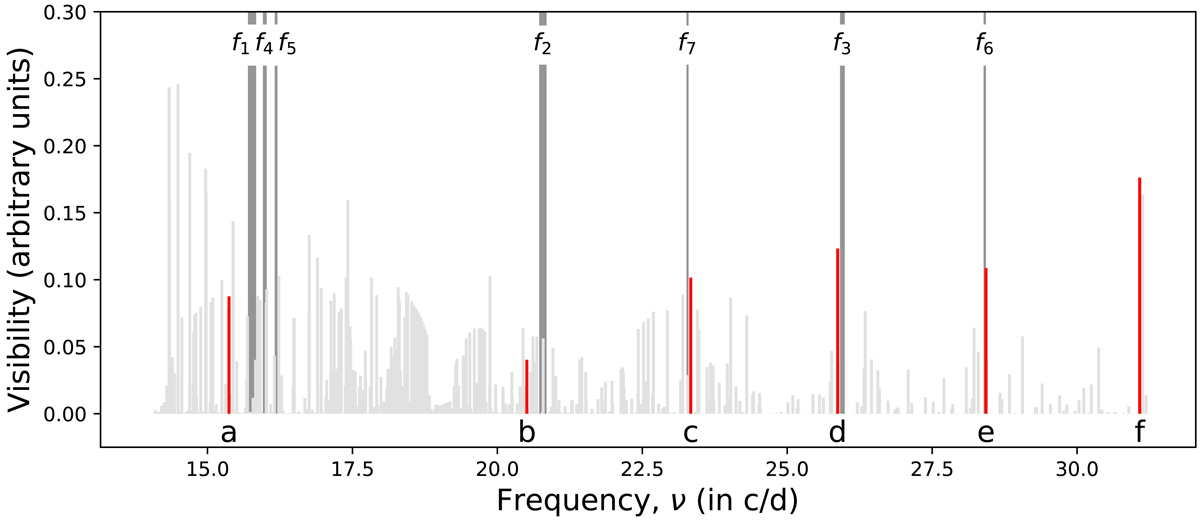
Theoretical pulsation spectrum for the M = 1.863 M⊙, X = 0.739 model. The dark grey lines that vertically span the plot are the observed pulsations (modes f1 to f7). Their thicknesses are proportional to the observed amplitudes. The light grey lines of different heights are the theoretical pulsations computed from the model. The red line segments correspond to identified island (or mixed gravito-island) modes, assumed to correspond to the observed modes. Meridional cross-sections of these 6 modes, labelled with the letters “a” to “f”, are shown in Fig. B.1. We note that no island pulsation mode was clearly identified around 18 c/d, probably as a result of an avoided crossing.
Current usage metrics show cumulative count of Article Views (full-text article views including HTML views, PDF and ePub downloads, according to the available data) and Abstracts Views on Vision4Press platform.
Data correspond to usage on the plateform after 2015. The current usage metrics is available 48-96 hours after online publication and is updated daily on week days.
Initial download of the metrics may take a while.