Open Access
Fig. 3
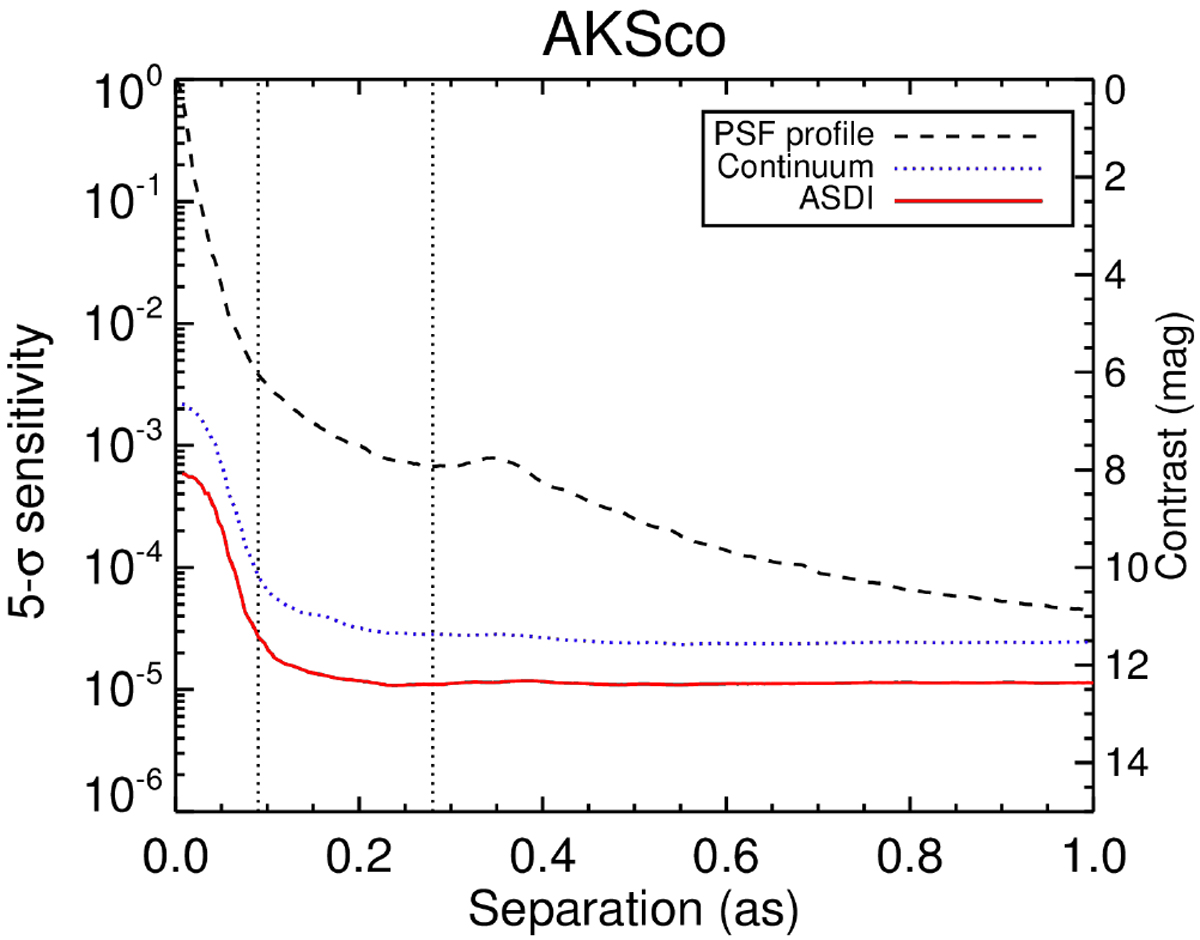
Contrast plot for the object AK Sco. In a black solid line, the profile of the PSF is shown, blue represents the Hα continuum filter after being processed with PCA and ADI, and red is the ASDI contrast. The vertical dotted lines represent the extension of the spirals (Janson et al. 2016).
Current usage metrics show cumulative count of Article Views (full-text article views including HTML views, PDF and ePub downloads, according to the available data) and Abstracts Views on Vision4Press platform.
Data correspond to usage on the plateform after 2015. The current usage metrics is available 48-96 hours after online publication and is updated daily on week days.
Initial download of the metrics may take a while.