Fig. 7.
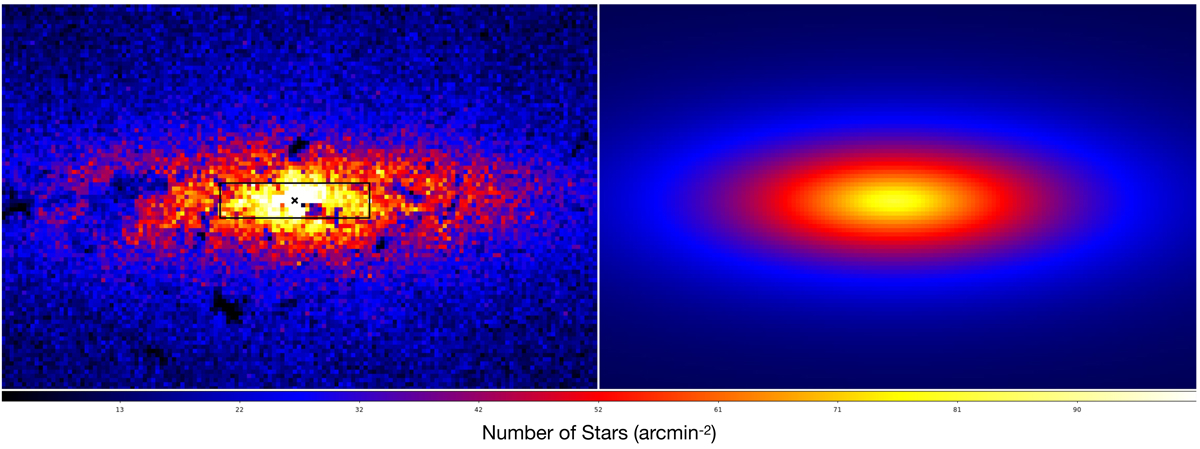
Map of the stellar density in the central 341 pc × 219 pc of our Galaxy. Both panels use the same color linear scales. Left panel: stellar number density map from Nishiyama et al. (2013). The black rectangle indicates the FOV of our data (∼86 pc × 20.2 pc). Sgr A* is located in the position of the black cross. Right panel: Sérsic plus triaxial ellipsoidal fit to the data after masking the central 10 pc occupied by the NSC and regions with low density.
Current usage metrics show cumulative count of Article Views (full-text article views including HTML views, PDF and ePub downloads, according to the available data) and Abstracts Views on Vision4Press platform.
Data correspond to usage on the plateform after 2015. The current usage metrics is available 48-96 hours after online publication and is updated daily on week days.
Initial download of the metrics may take a while.