Free Access
Fig. 10.
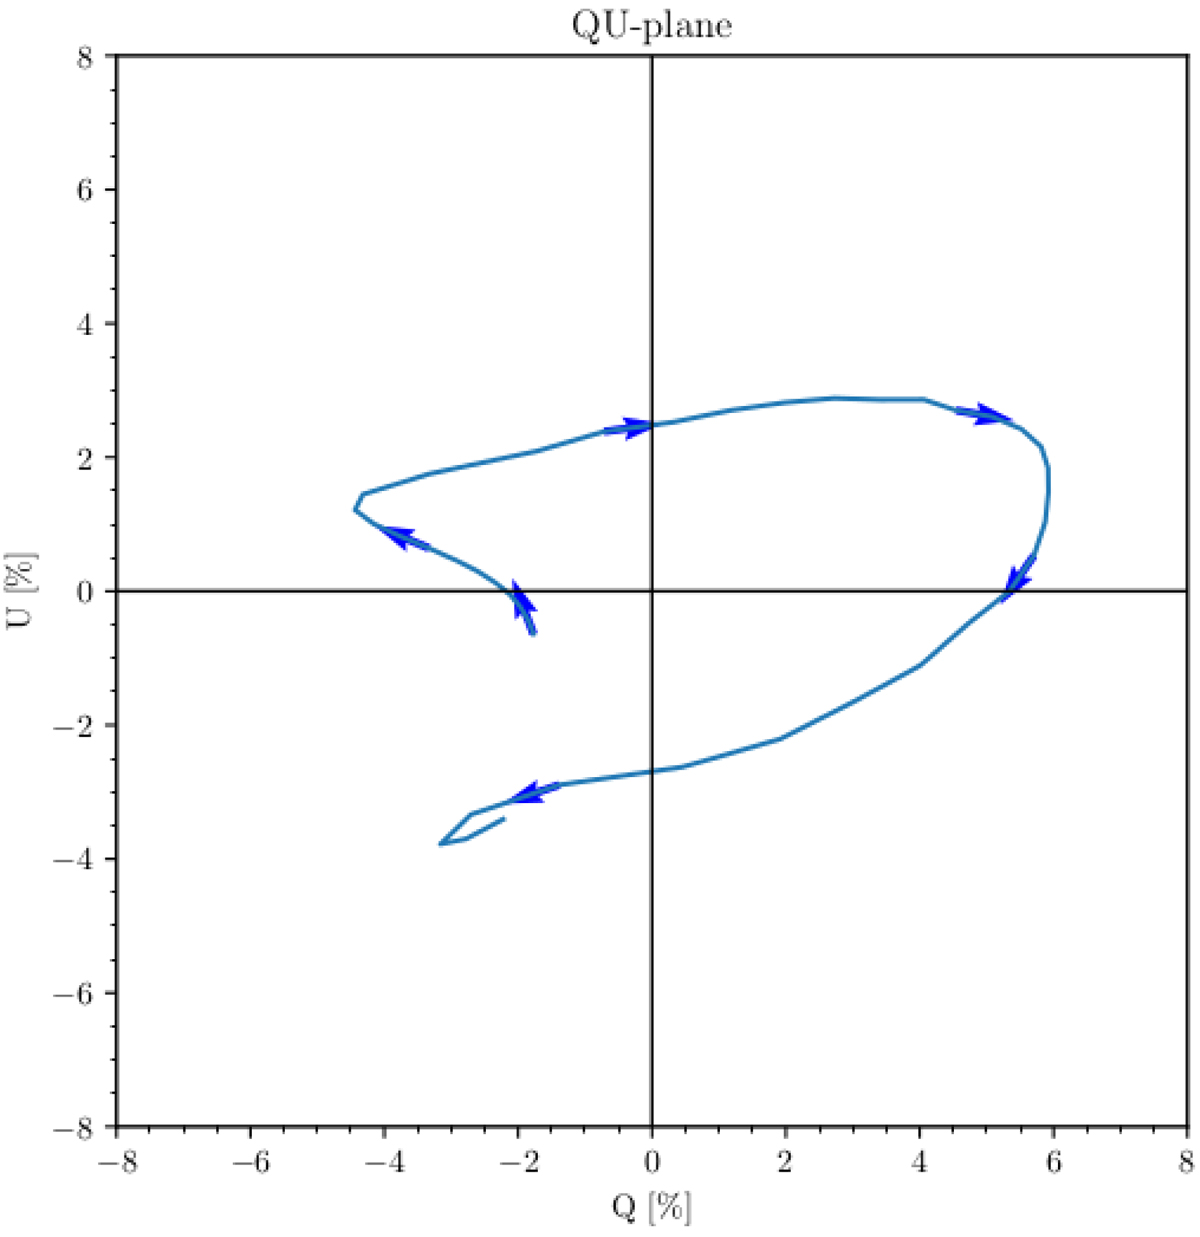
Variation in Stokes parameters Q and U along the crossing path defined in Fig. 8. Arrows denote the direction in which Q and U evolve as the source crosses the path on the microlening map, starting from left to right.
Current usage metrics show cumulative count of Article Views (full-text article views including HTML views, PDF and ePub downloads, according to the available data) and Abstracts Views on Vision4Press platform.
Data correspond to usage on the plateform after 2015. The current usage metrics is available 48-96 hours after online publication and is updated daily on week days.
Initial download of the metrics may take a while.