Fig. A.4.
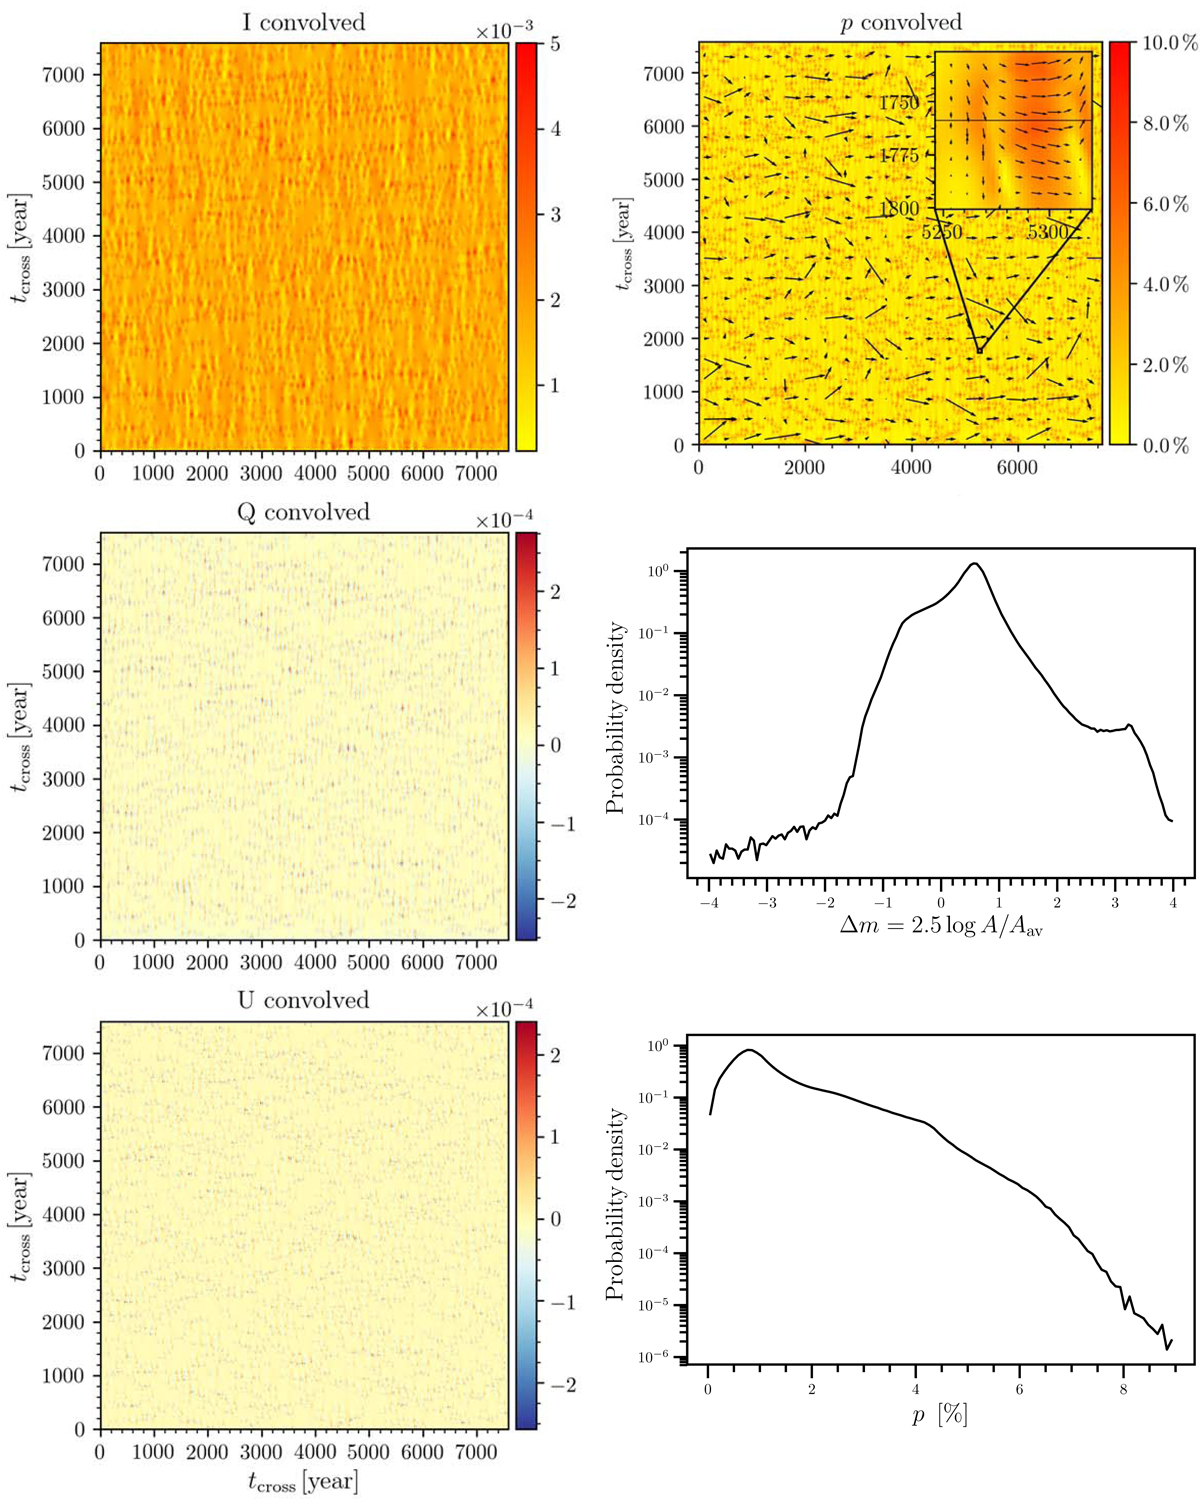
Left: convolution of the total intensity (top panel) and Stokes parameters Q (middle panel) and U (bottom panel) with the modeled magnification map for component D. Right: first panel up presents 2D distribution of the degree of polarization, p (coded in color levels and in the length of the arrows) and polarization angle φ represented using arrows (arrows parallel to the Y-axis correspond to zero angle). The inset at the top is the map we used to calculate the polarization amplification (see text and Fig. 9). Second and third panels (right) show the probably density functions for the amplification and polarization rate, respectively.
Current usage metrics show cumulative count of Article Views (full-text article views including HTML views, PDF and ePub downloads, according to the available data) and Abstracts Views on Vision4Press platform.
Data correspond to usage on the plateform after 2015. The current usage metrics is available 48-96 hours after online publication and is updated daily on week days.
Initial download of the metrics may take a while.