Fig. 8.
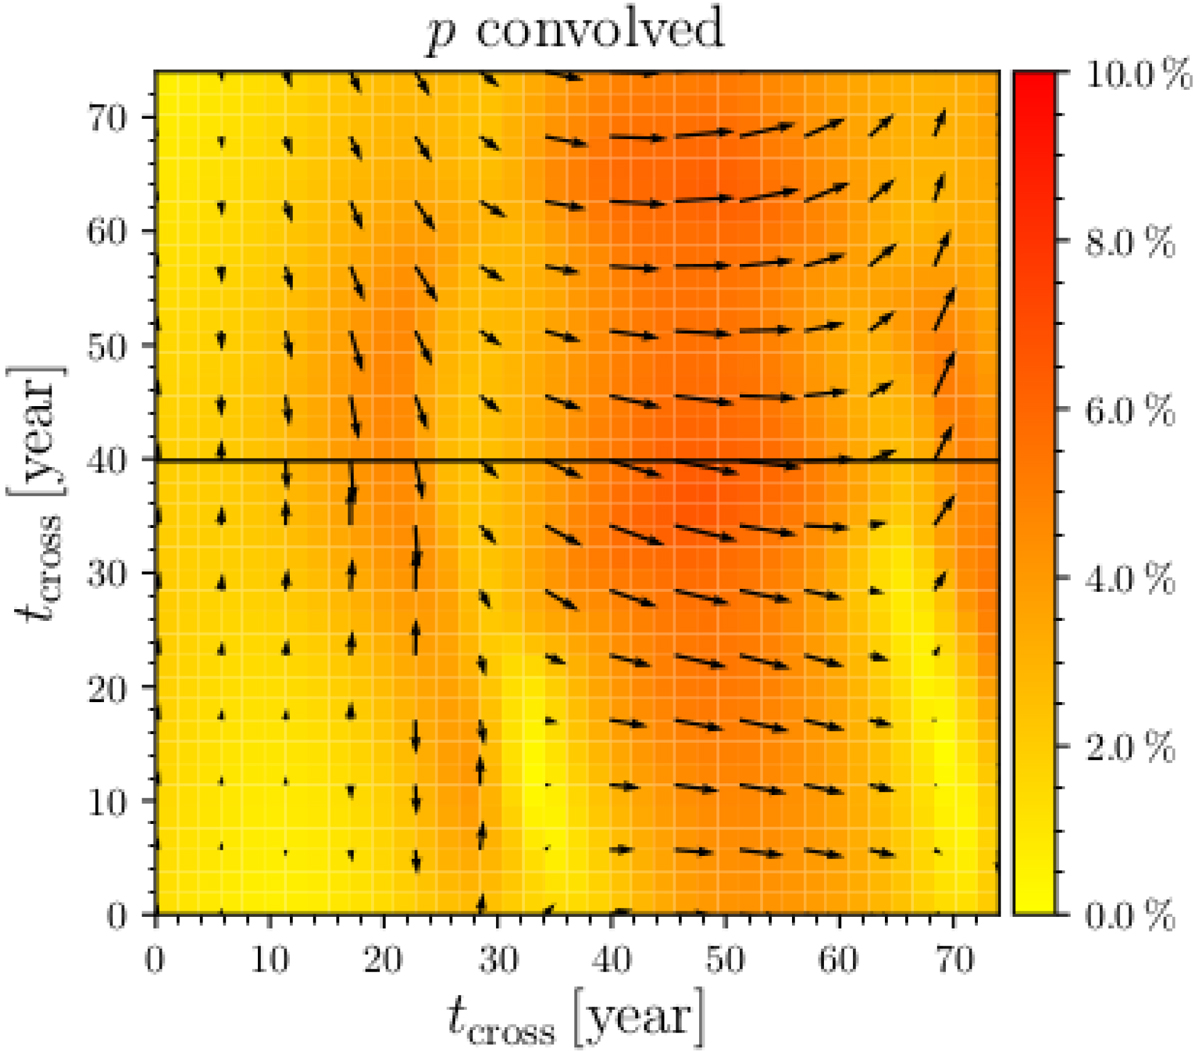
Magnification map (see Appendix A) showing the effect of microlensing on the degree of polarization p (given in color) and on the polarization angle φ (arrows). The level of polarization is given in percent. Arrows paralell to the Y-axis correspond to φ = 0, and the arrow length corresponds to the p value. The solid black line represents the path of the source, starting from left to right. This map is a subregion of a much larger magnification map shown in Appendix A.
Current usage metrics show cumulative count of Article Views (full-text article views including HTML views, PDF and ePub downloads, according to the available data) and Abstracts Views on Vision4Press platform.
Data correspond to usage on the plateform after 2015. The current usage metrics is available 48-96 hours after online publication and is updated daily on week days.
Initial download of the metrics may take a while.