Fig. 2.
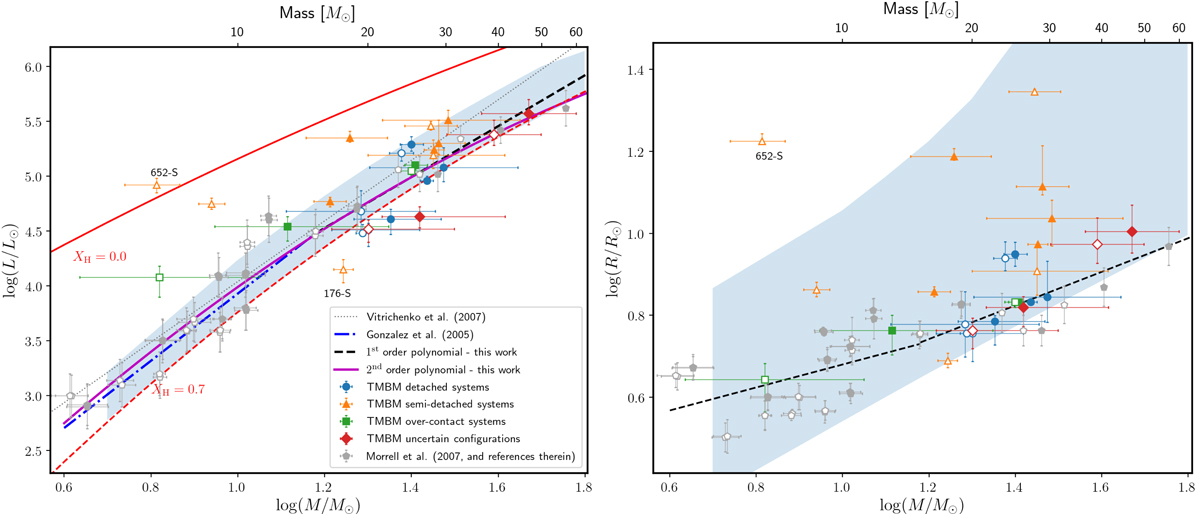
Left: mass-luminosity diagram of all the components in our sample and from Morrell et al. (2007, and references therein). Detached systems are represented in blue, semi-detached systems in orange, over-contact systems in green, and systems with uncertain configurations in red. The grey dots represent the sample of Morrell et al. The blue shaded zone indicates the main sequence from the tracks of Brott et al. (2011) and Köhler et al. (2015), computed with initial rotational velocity equal to 150 km s−1. Overplotted in dashed and solid lines are the mass-luminosity relations of Gräfener et al. (2011) for chemically homogeneous stars with a hydrogen mass fraction of XH = 0.7 and XH = 0. Right: mass-radius diagram built from our sample and from the sample of Morrell et al. (2007). The colour-coding is the same as in the left panel.
Current usage metrics show cumulative count of Article Views (full-text article views including HTML views, PDF and ePub downloads, according to the available data) and Abstracts Views on Vision4Press platform.
Data correspond to usage on the plateform after 2015. The current usage metrics is available 48-96 hours after online publication and is updated daily on week days.
Initial download of the metrics may take a while.