Fig. 12.
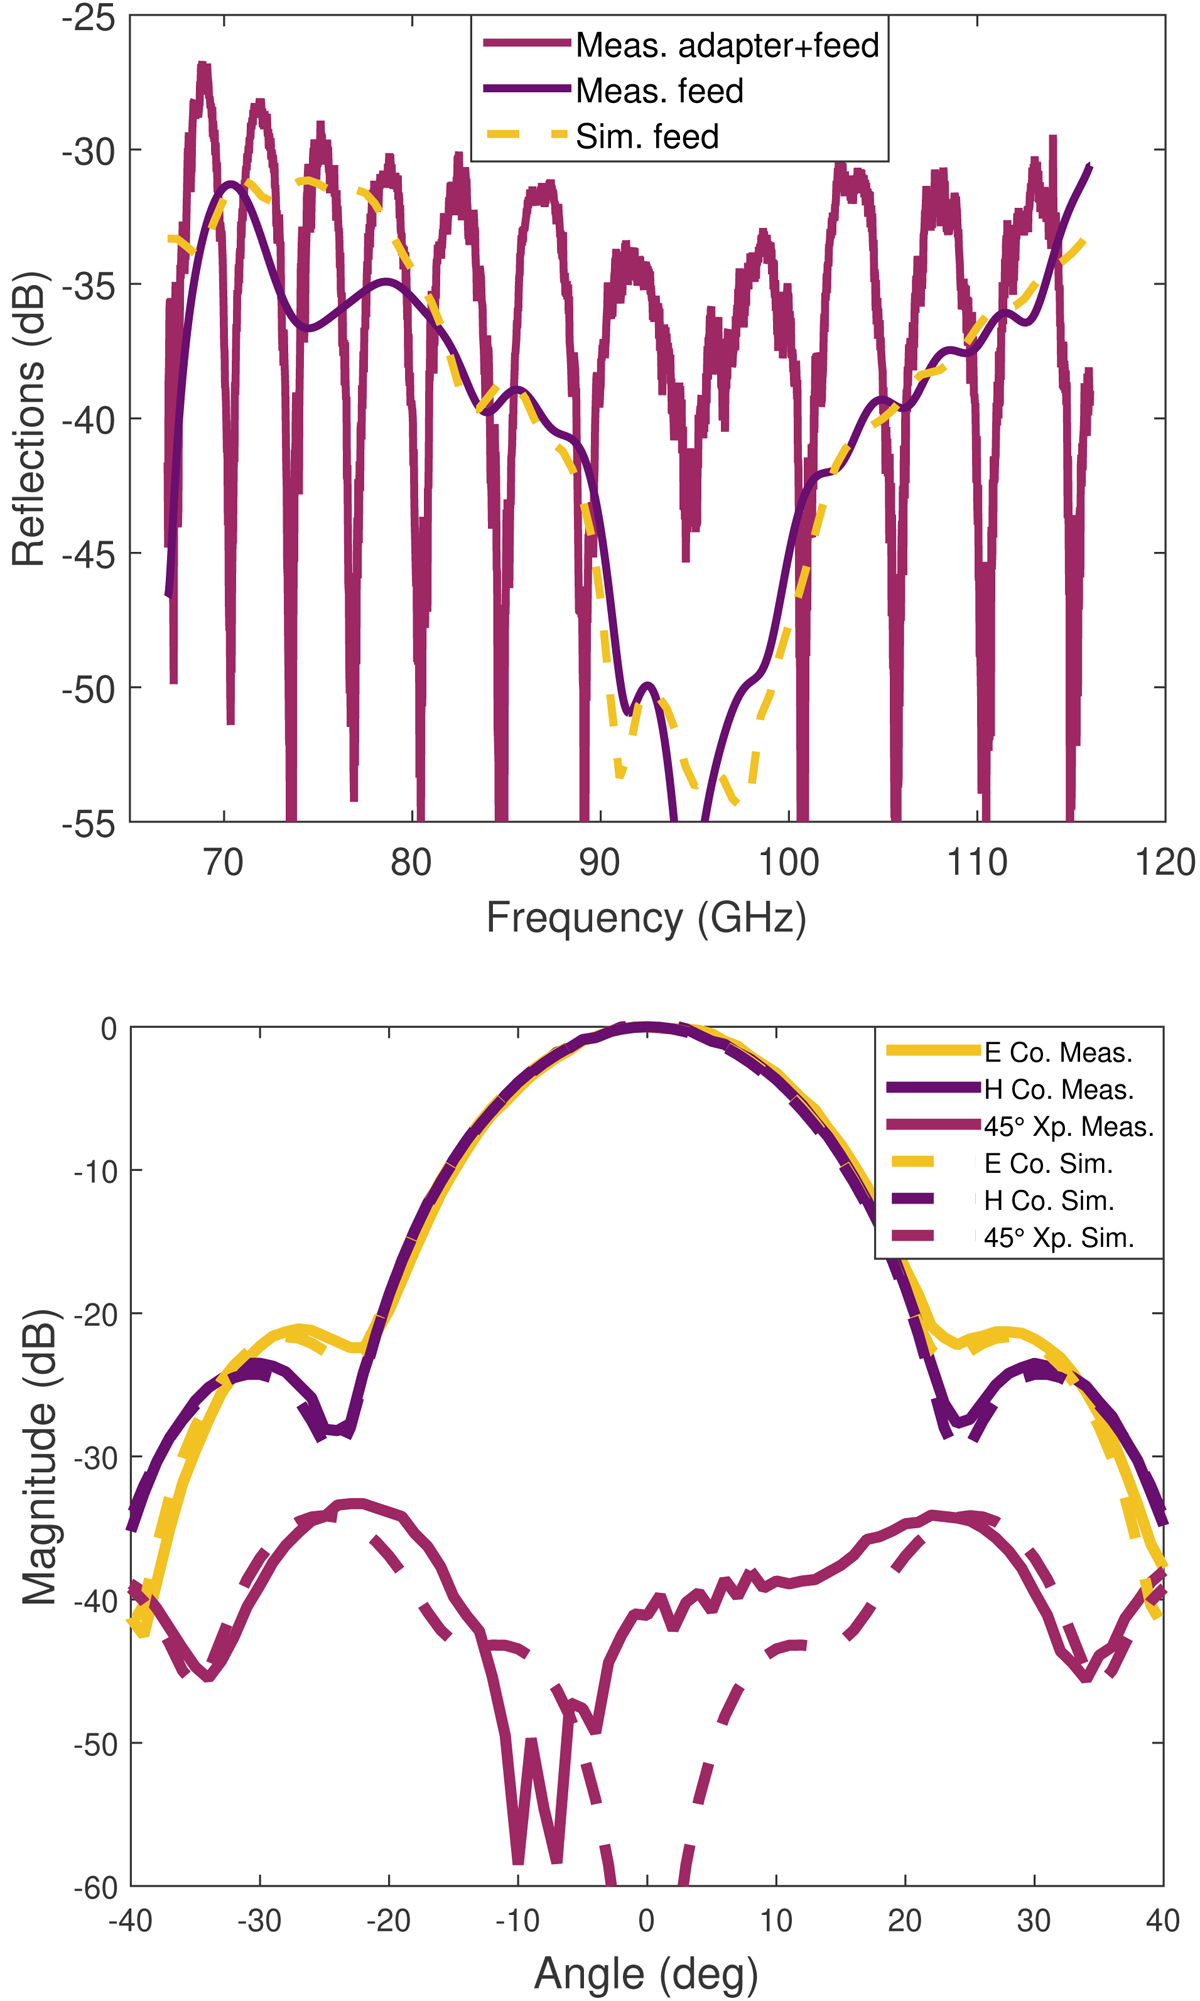
Upper panel: reflected power S11 for the feedhorn designed at INAF. Here, the simulation data are compared with the measurements. The effect of the adaptor used for the measurements is also shown, in lighter purple. Lower panel: INAF feedhorn test results for co-polar (Co) and cross-polar (Xp) beam pattern cuts: E-plane (E), H-plane (H) and 45°-plane. The results for the measurements (lines) versus the simulations (dashed) are shown near the band centre, 91.5 GHz. Our EM simulations confirm that the beam properties scale smoothly as a function of wavelength and, hence, we only show one representative frequency.
Current usage metrics show cumulative count of Article Views (full-text article views including HTML views, PDF and ePub downloads, according to the available data) and Abstracts Views on Vision4Press platform.
Data correspond to usage on the plateform after 2015. The current usage metrics is available 48-96 hours after online publication and is updated daily on week days.
Initial download of the metrics may take a while.