Free Access
Fig. 2.
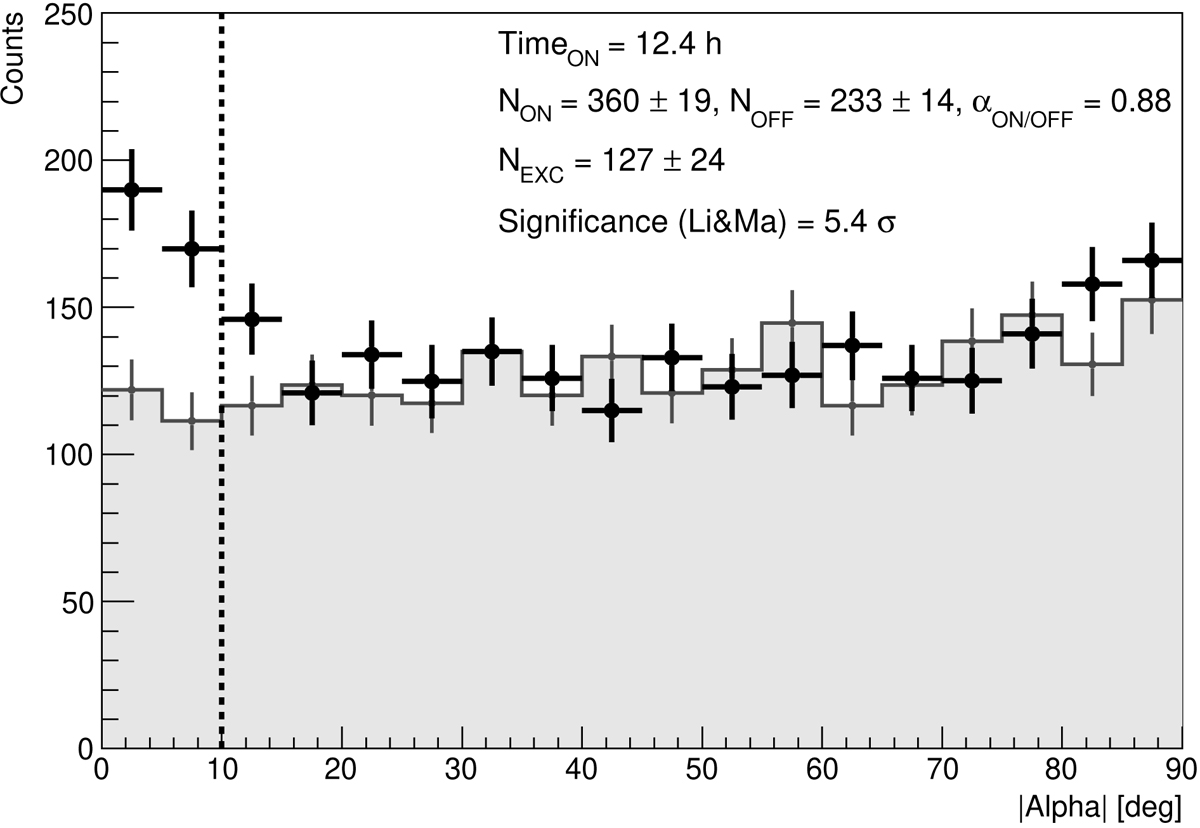
∣Alpha∣-distributions of the Crab Nebula (ON, black) and the background (OFF, grey) data from ASTRI-Horn observations taken between 5 and 11 December 2018 above an energy threshold of ∼3 TeV. The region between zero and the vertical dashed line (at 10°) represents the fiducial signal region.
Current usage metrics show cumulative count of Article Views (full-text article views including HTML views, PDF and ePub downloads, according to the available data) and Abstracts Views on Vision4Press platform.
Data correspond to usage on the plateform after 2015. The current usage metrics is available 48-96 hours after online publication and is updated daily on week days.
Initial download of the metrics may take a while.