Fig. 1.
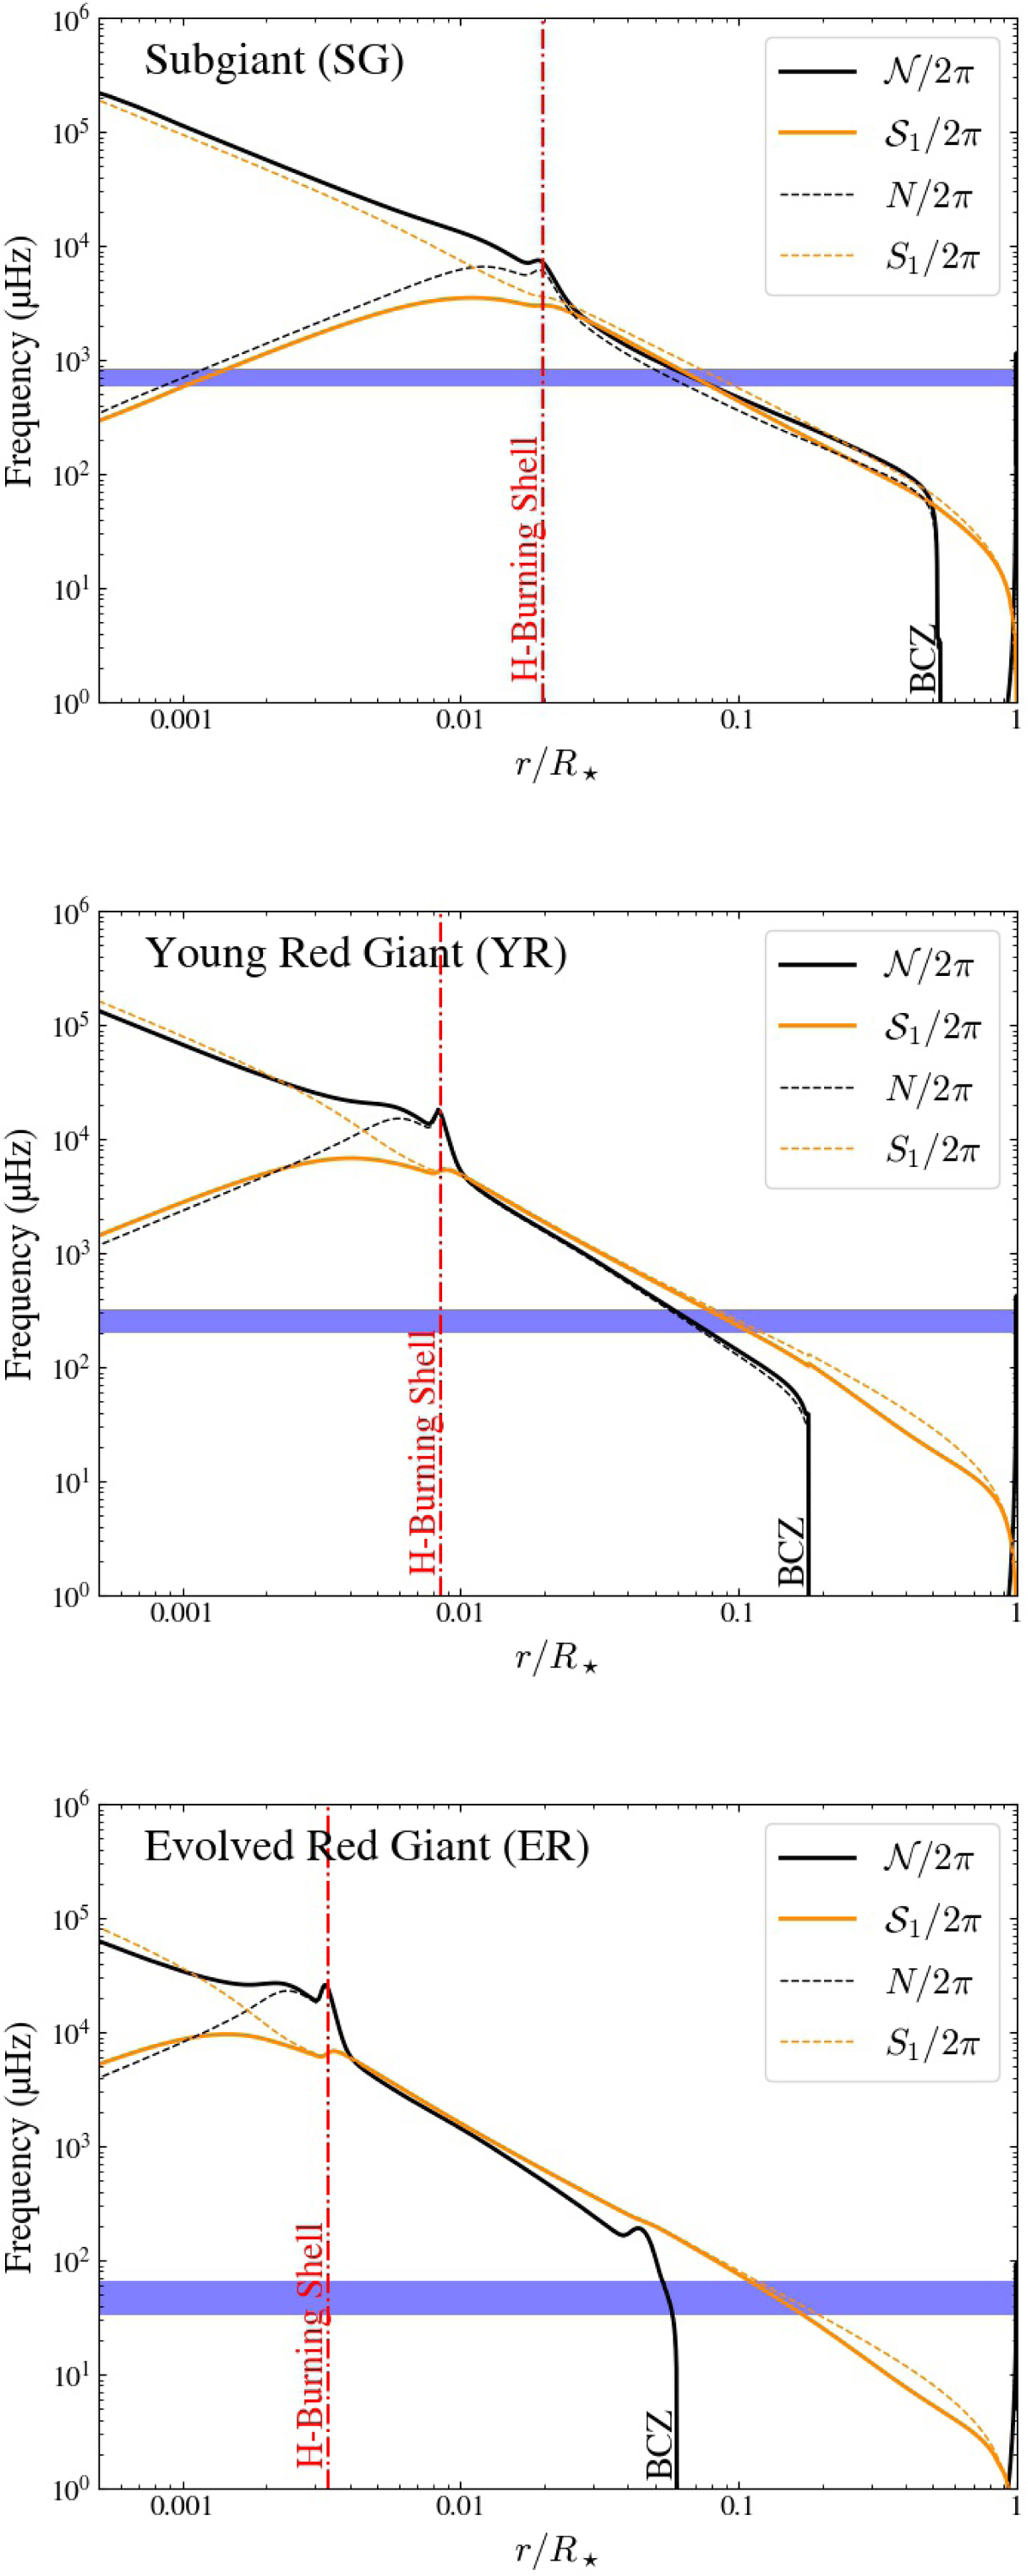
Profiles of the modified (solid lines) and usual (dashed lines) Brunt–Väisälä and Lamb frequencies (for ℓ = 1) as a function of radius in three 1.2 M⊙ stellar models, corresponding to a subgiant star (SG), a young (YR) and an evolved (ER) red giant stars, respectively (see HR diagram in Fig. 3). The base of the convective zone (BCZ) and the hydrogen-burning shell (vertical dash-dotted line) are indicated. The blue horizontal strip symbolizes a 6Δν-wide frequency range around νmax computed via Eqs. (6) and (7). Propagation occurs where 2πν ≲ (𝒩 and 𝒮1) or 2πν ≳ (𝒩 and 𝒮1), and evanescence otherwise.
Current usage metrics show cumulative count of Article Views (full-text article views including HTML views, PDF and ePub downloads, according to the available data) and Abstracts Views on Vision4Press platform.
Data correspond to usage on the plateform after 2015. The current usage metrics is available 48-96 hours after online publication and is updated daily on week days.
Initial download of the metrics may take a while.