Fig. 3.
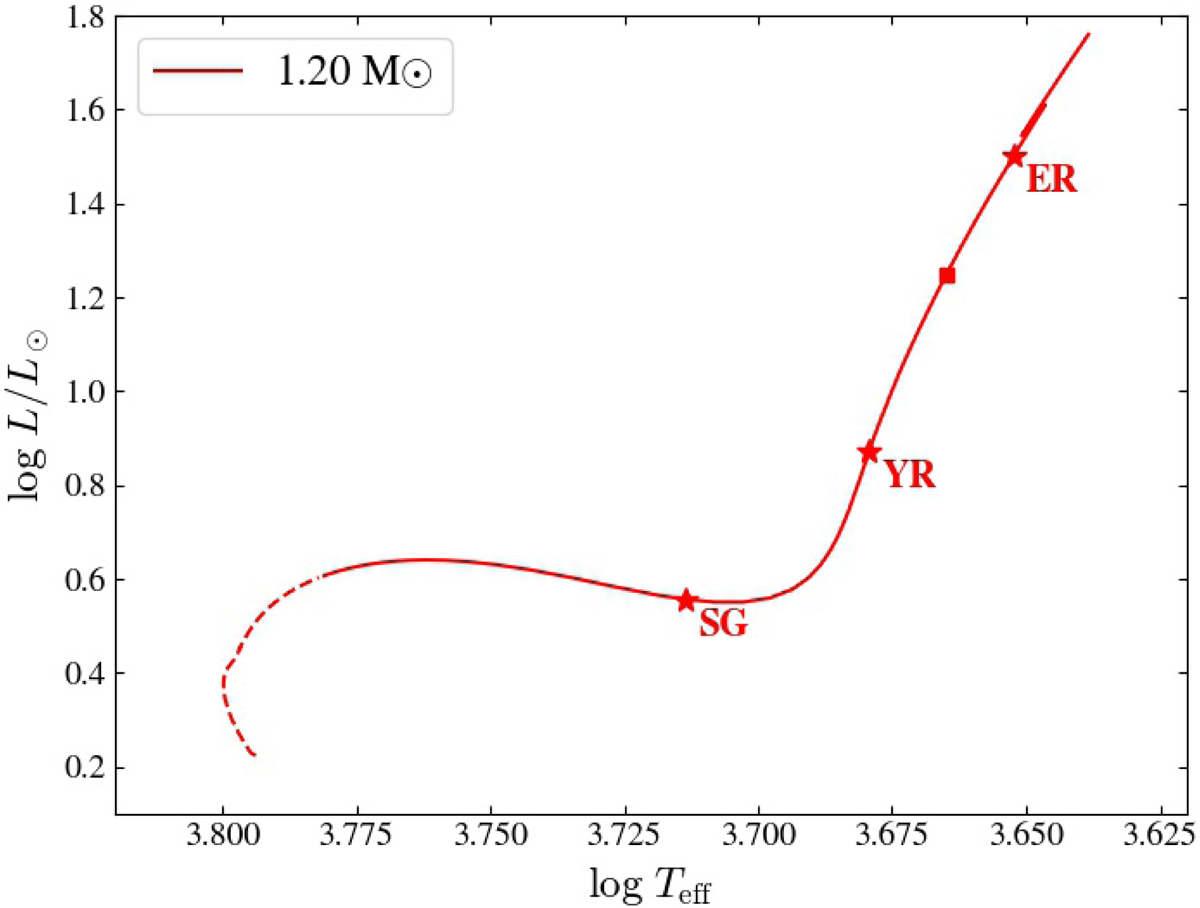
Evolutionary sequence of 1.2 M⊙ stellar models in the HR diagram, from the zero-age main sequence to the tip of the RGB. The solid line represents the domain where a coupling between the core and the envelope is possible and mixed modes can be observed, unlike the dashed line. The red stars represent the three models (SG, YR and ER) considered as examples in Fig. 1. The square qualitatively labels the transition point from a Type-a evanescent region to a Type-b evanescent region.
Current usage metrics show cumulative count of Article Views (full-text article views including HTML views, PDF and ePub downloads, according to the available data) and Abstracts Views on Vision4Press platform.
Data correspond to usage on the plateform after 2015. The current usage metrics is available 48-96 hours after online publication and is updated daily on week days.
Initial download of the metrics may take a while.