Fig. 4.
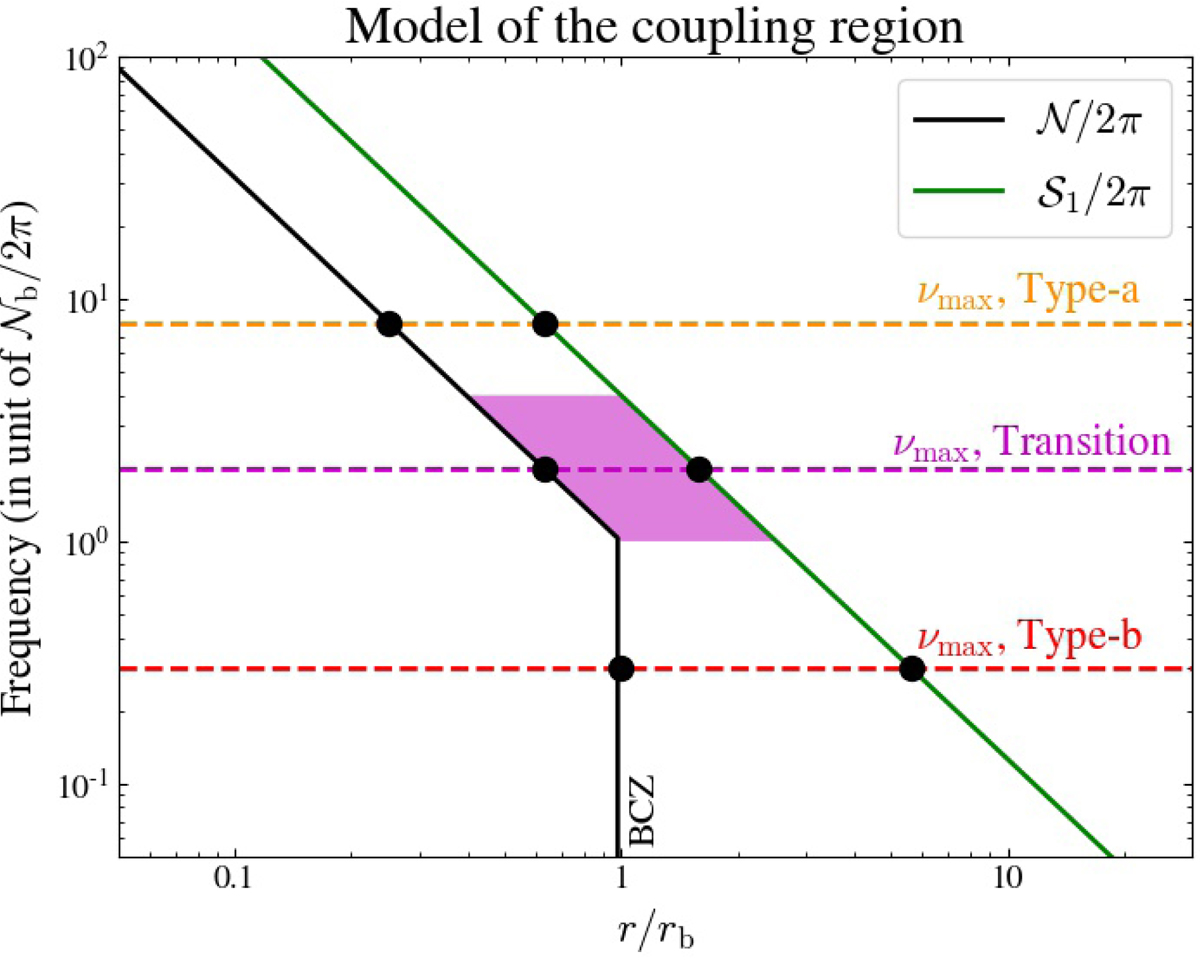
Schematic view of the profiles of the (modified) Brunt–Väisälä and Lamb frequencies as a function of the radius normalized by the radius of the base of the convective zone, rb. The value of νmax in the case of Type-a and Type-b evanescent regions, as well as at the transition between both regimes, are indicated by the orange, magenta and red dashed lines, respectively. The black dots correspond to the turning points for the three cases. The magenta domain delimits all the possible locations of the evanescent regions in the transition regime.
Current usage metrics show cumulative count of Article Views (full-text article views including HTML views, PDF and ePub downloads, according to the available data) and Abstracts Views on Vision4Press platform.
Data correspond to usage on the plateform after 2015. The current usage metrics is available 48-96 hours after online publication and is updated daily on week days.
Initial download of the metrics may take a while.