Fig. 6.
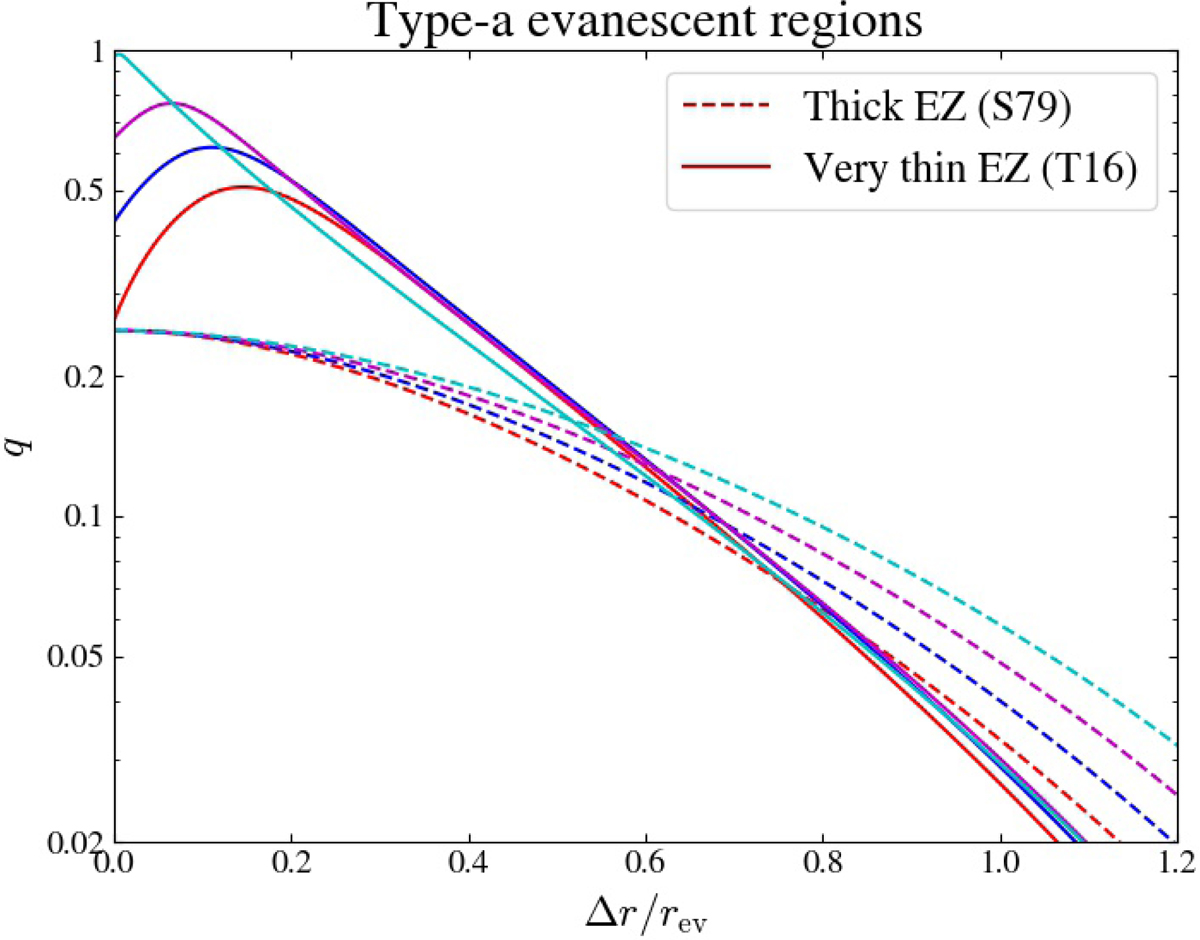
Coupling factor as a function of the normalized radial extent of the evanescent region in Type-a evanescent regions, as expected from the model. The cyan, blue, magenta and red colors represent the result for a typical range of values of the β parameter, i.e., β = 1.2, 1.3, 1.4, and 1.5, respectively. The dashed lines correspond to the predictions obtained with the formalism of Shibahashi (1979) according to Eqs. (19), (20) and (24). The solid lines correspond to the predictions computed in the formalism of Takata (2016a) according to Eqs. (13), (21), (24) and (26).
Current usage metrics show cumulative count of Article Views (full-text article views including HTML views, PDF and ePub downloads, according to the available data) and Abstracts Views on Vision4Press platform.
Data correspond to usage on the plateform after 2015. The current usage metrics is available 48-96 hours after online publication and is updated daily on week days.
Initial download of the metrics may take a while.