Fig. 8.
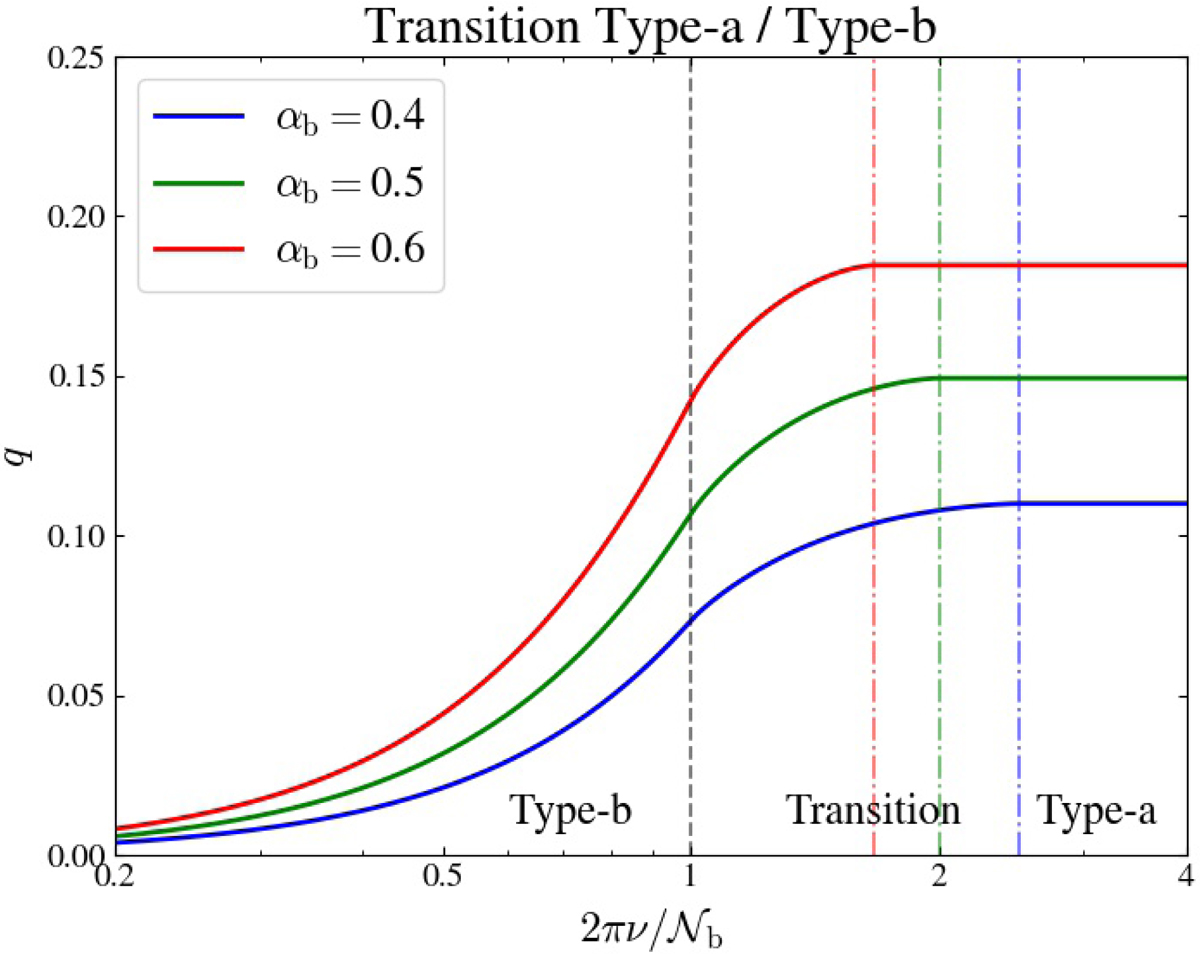
Evolution of the coupling factor as a function the ratio 2πν/𝒩b (solid lines), such as predicted in Sect. 4.3 and for different values of αb = 𝒮b/𝒩b, where 𝒩b and 𝒮b are the values of the modified Brunt–Väisälä and Lamb frequencies just below the base of the convective region. When considering ν ≈ νmax, stellar evolution goes from the right to the left. The black dashed line indicates the beginning of the Type-b regime. The dash-dotted lines delimit the end of the Type-a regime for the considered values of αb, with the corresponding colors.
Current usage metrics show cumulative count of Article Views (full-text article views including HTML views, PDF and ePub downloads, according to the available data) and Abstracts Views on Vision4Press platform.
Data correspond to usage on the plateform after 2015. The current usage metrics is available 48-96 hours after online publication and is updated daily on week days.
Initial download of the metrics may take a while.