Fig. 9.
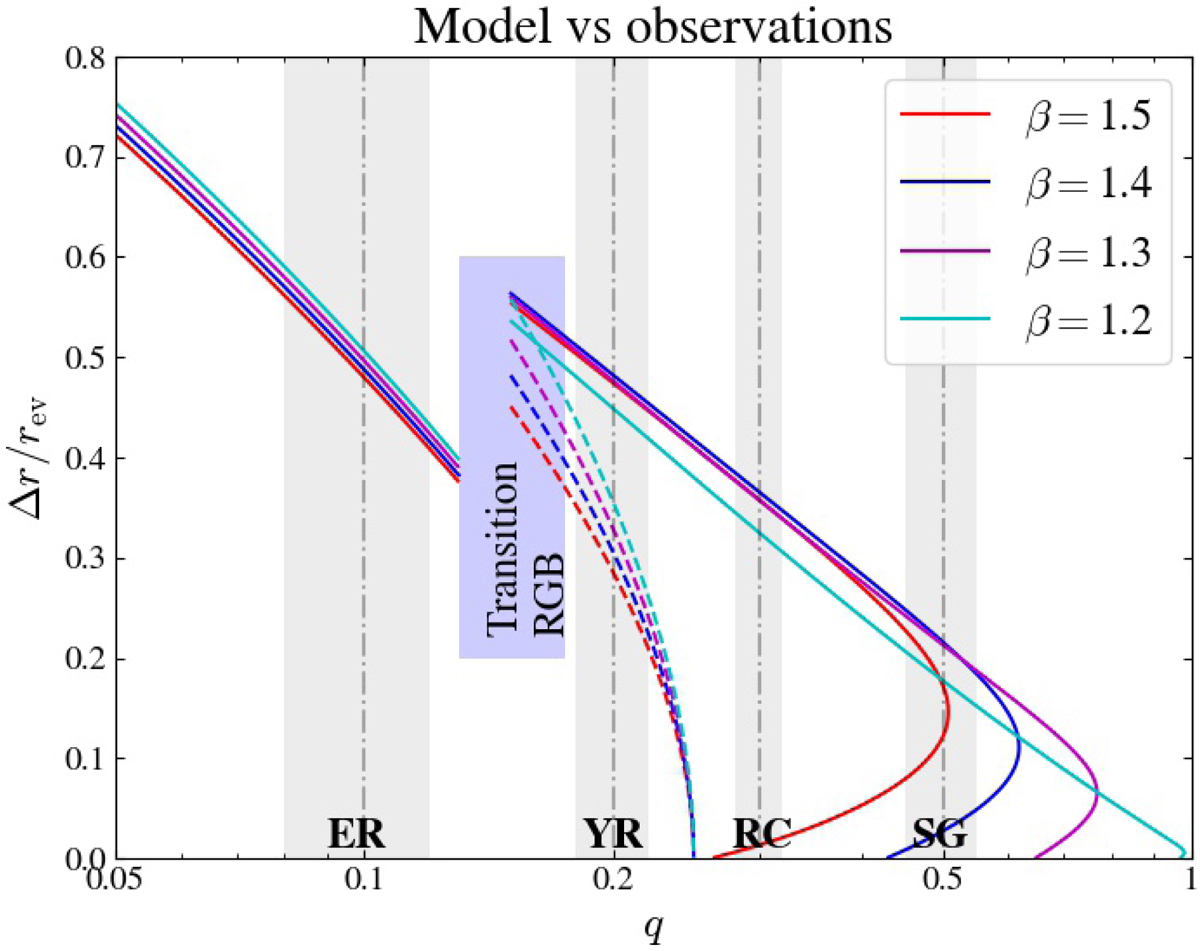
Normalized extent of the evanescent region as a function of q, for typical values of β. Solid lines represent the predictions of the model in the cases of Type-a very thin evanescent regions and thick Type-b evanescent regions for q ≳ 0.15 and q ≲ 0.13, respectively. The dashed lines correspond to the predictions for thick Type-a evanescent regions for q ≳ 0.15. The blue rectangle indicates the estimated domain of the transition regime between Type-a and Type-b evanescent regions on the RGB. Typical values (vertical dash-dotted lines) and their error bars (vertical gray strips) are represented for subgiant (SG), young red giant (YR), evolved red giant (ER) and red clump (RC) stars (see main text).
Current usage metrics show cumulative count of Article Views (full-text article views including HTML views, PDF and ePub downloads, according to the available data) and Abstracts Views on Vision4Press platform.
Data correspond to usage on the plateform after 2015. The current usage metrics is available 48-96 hours after online publication and is updated daily on week days.
Initial download of the metrics may take a while.