Fig. 5
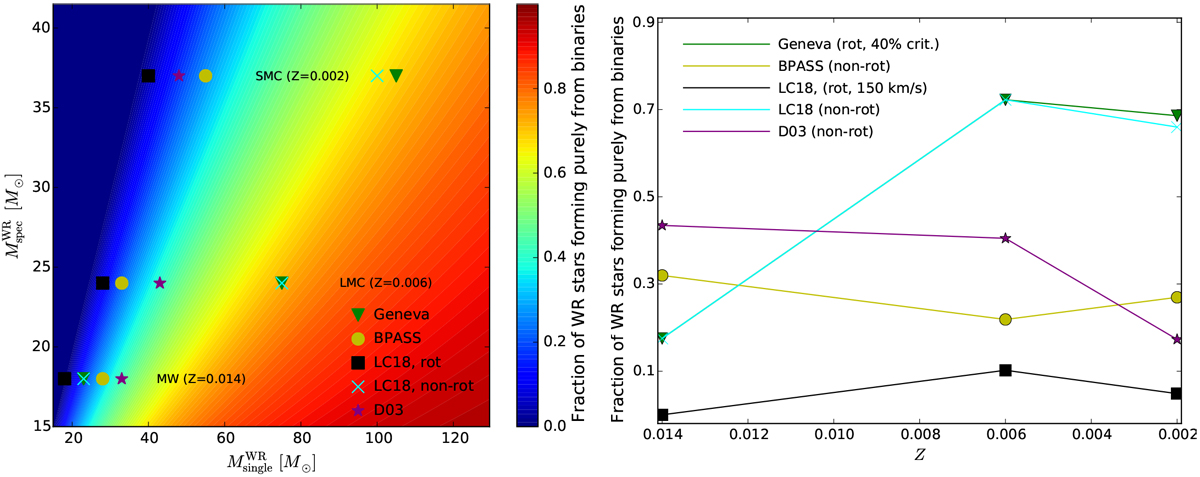
Left: color map depicting the relative contribution of the binary channel (Eq. (4)) on the
![]() –
–![]() plane. Marked are the relative contributions obtained for the
plane. Marked are the relative contributions obtained for the ![]() values derived here for Z = 0.014, 0.006, and 0.002 (18, 24, 37 M⊙) and the
values derived here for Z = 0.014, 0.006, and 0.002 (18, 24, 37 M⊙) and the ![]() values predicted bythe BPASS, Geneva, FRANEC, and STARS evolution codes (cf. Table 1). Right: translation of the left panel to the Z-axis, showing the relative contribution of the binary channel (Eq. (4)) as a function of
Z
according tothe various evolution models.
values predicted bythe BPASS, Geneva, FRANEC, and STARS evolution codes (cf. Table 1). Right: translation of the left panel to the Z-axis, showing the relative contribution of the binary channel (Eq. (4)) as a function of
Z
according tothe various evolution models.
Current usage metrics show cumulative count of Article Views (full-text article views including HTML views, PDF and ePub downloads, according to the available data) and Abstracts Views on Vision4Press platform.
Data correspond to usage on the plateform after 2015. The current usage metrics is available 48-96 hours after online publication and is updated daily on week days.
Initial download of the metrics may take a while.