Free Access
Fig. 2.
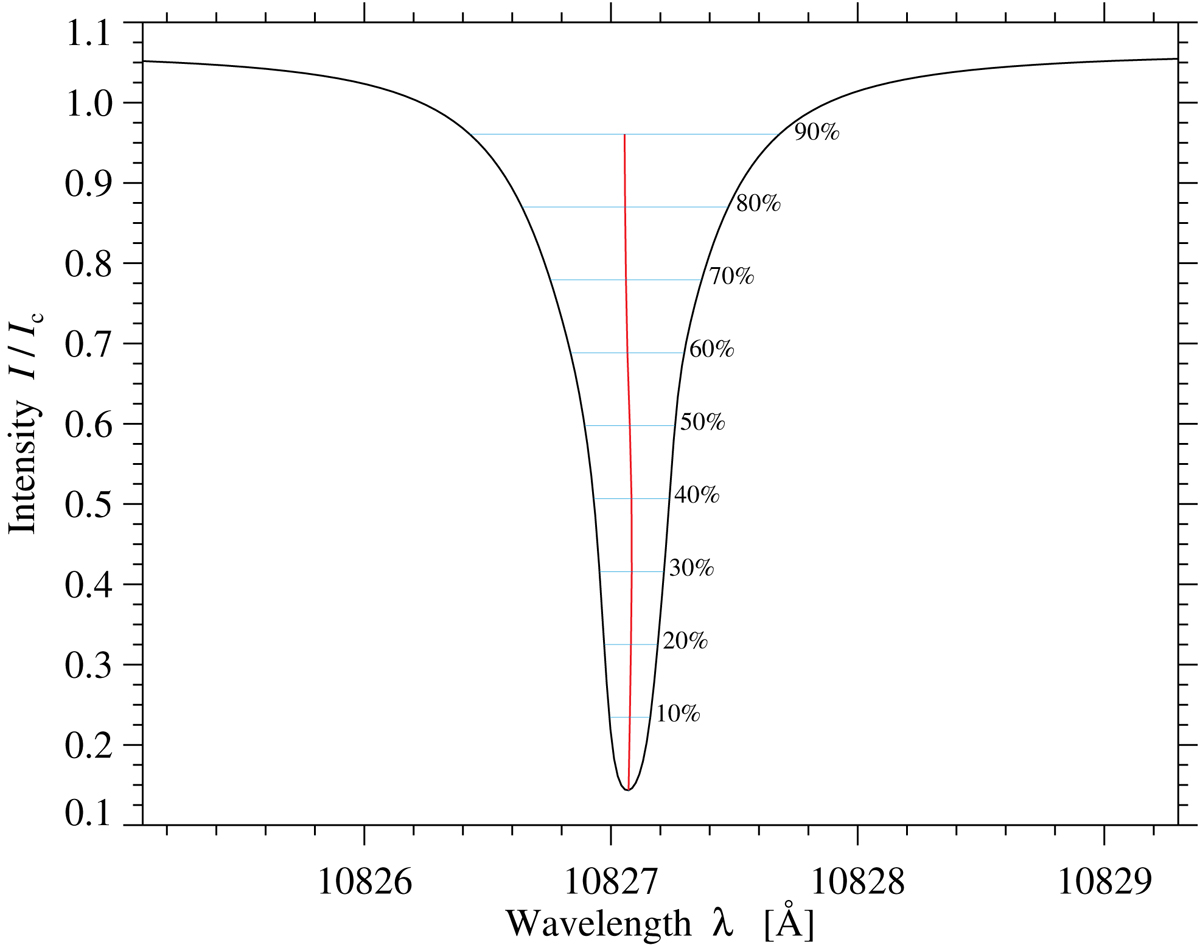
Reference intensity values used for computing the bisectors of the Si I 10 827 Å line. The background profile corresponds to the spatially averaged intensity over the entire FOV presented in Fig. 1, normalised to the local continuum intensity Ic.
Current usage metrics show cumulative count of Article Views (full-text article views including HTML views, PDF and ePub downloads, according to the available data) and Abstracts Views on Vision4Press platform.
Data correspond to usage on the plateform after 2015. The current usage metrics is available 48-96 hours after online publication and is updated daily on week days.
Initial download of the metrics may take a while.