Fig. 5.
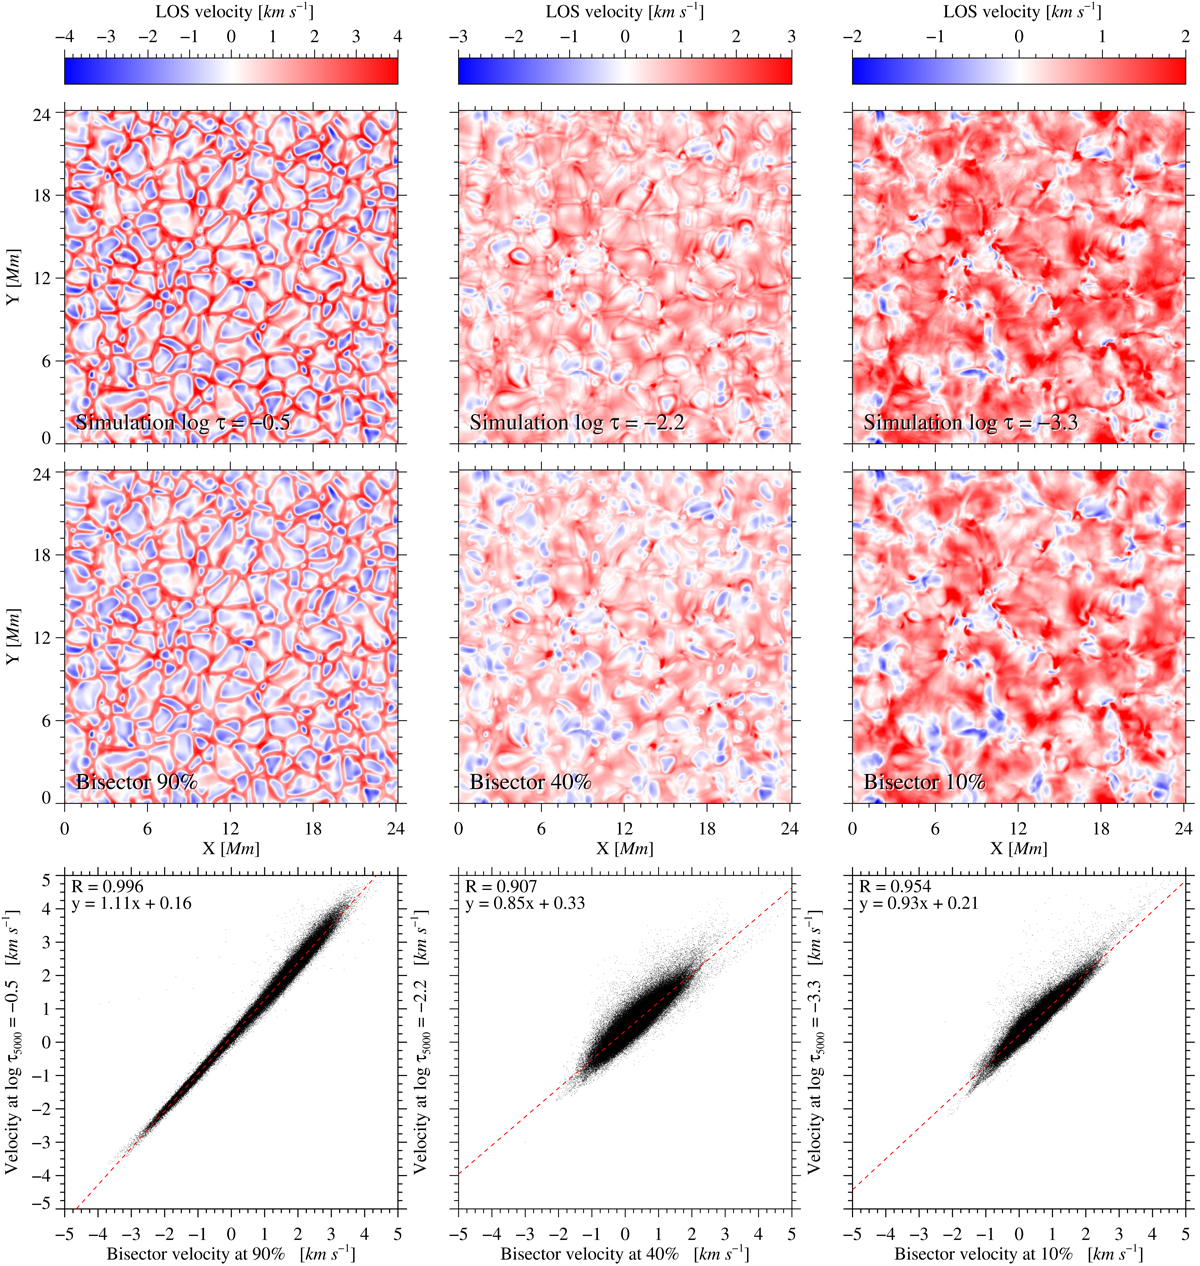
Line-of-sight velocity maps from the original simulation (top) and those inferred using the bisector method (middle). We include in the bottom row a scatter plot and the Pearson correlation between both maps. Each column designates a different height (in the case of the simulation) and bisector velocity at different line depths.
Current usage metrics show cumulative count of Article Views (full-text article views including HTML views, PDF and ePub downloads, according to the available data) and Abstracts Views on Vision4Press platform.
Data correspond to usage on the plateform after 2015. The current usage metrics is available 48-96 hours after online publication and is updated daily on week days.
Initial download of the metrics may take a while.