Fig. 7.
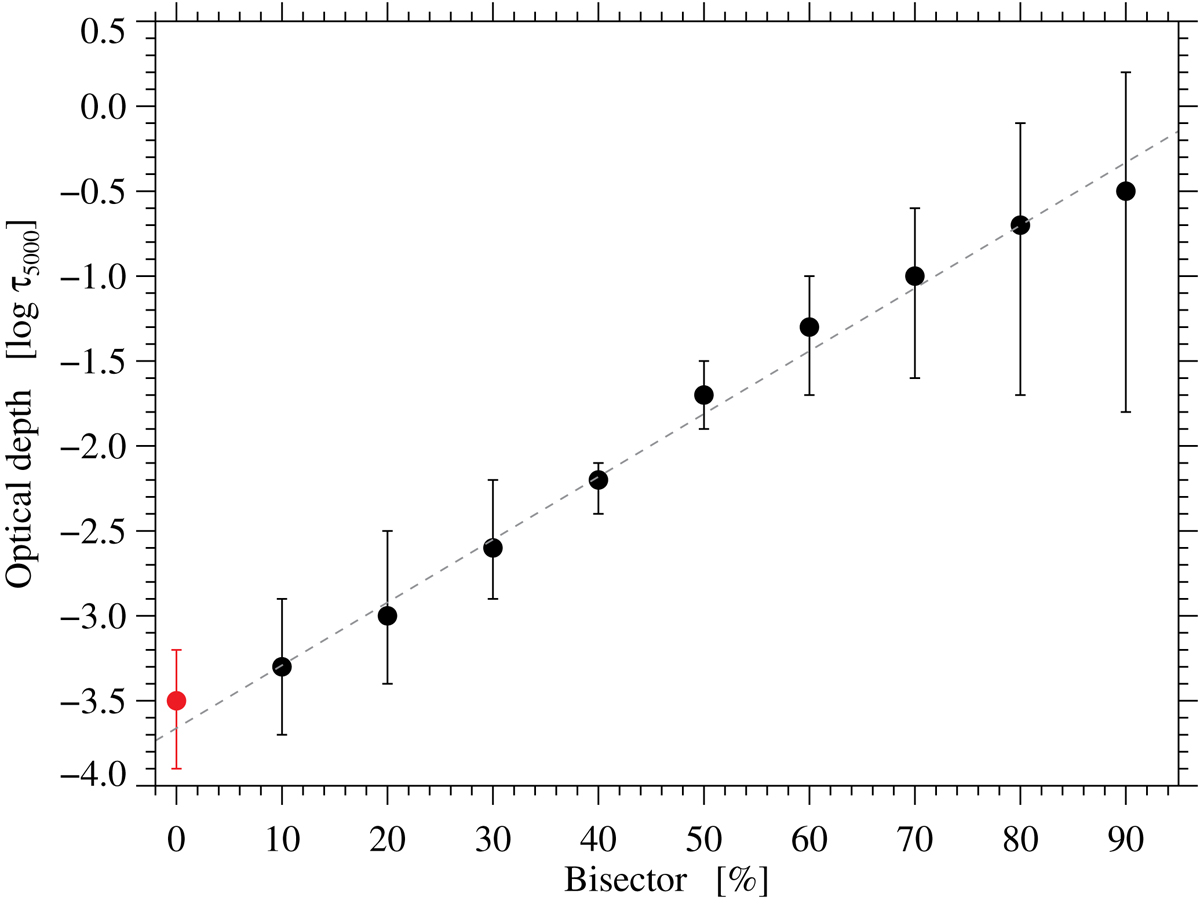
Comparison between Si I 10 827 Å LOS velocity maps of the height-dependent bisectors method and LOS maps of the simulation snapshot transformed to optical depth. The filled circles depict the highest correlation for each bisector map at a given line depth. The dashed line illustrates the linear fitting between all the bisectors (black dots). The red filled circle designates the results from the line-core fit using a second-order polynomial. Uncertainty bars indicate the optical depths where the correlation is higher than 90% for each bisector level.
Current usage metrics show cumulative count of Article Views (full-text article views including HTML views, PDF and ePub downloads, according to the available data) and Abstracts Views on Vision4Press platform.
Data correspond to usage on the plateform after 2015. The current usage metrics is available 48-96 hours after online publication and is updated daily on week days.
Initial download of the metrics may take a while.