Fig. 12.
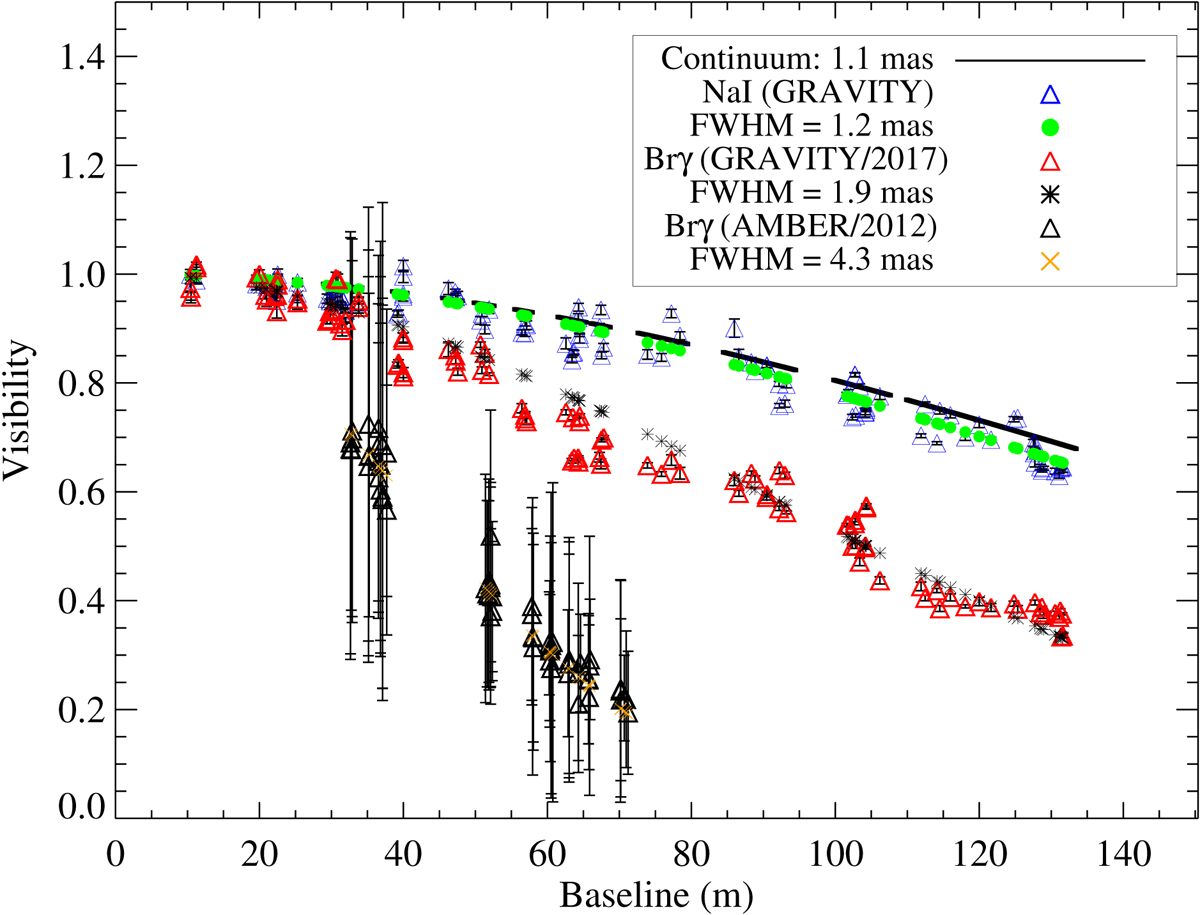
Visibilities at the peak of the Brγ, Na I emission lines and continuum emission towards IRAS 17163 overplotted with simple geometrical Gaussian models. Na I and continuum emission follow very similar distribution. Na I shows a smaller drop in visibilities compared to Brγ, indicating that Na I stems from a smaller emitting area compared to the Brγ. The AMBER dataset was rebinned to match the spectral resolution of GRAVITY. A period of 5 yr indicates a shrinkage of the Brγ emitting region to half its size.
Current usage metrics show cumulative count of Article Views (full-text article views including HTML views, PDF and ePub downloads, according to the available data) and Abstracts Views on Vision4Press platform.
Data correspond to usage on the plateform after 2015. The current usage metrics is available 48-96 hours after online publication and is updated daily on week days.
Initial download of the metrics may take a while.