Fig. 15.
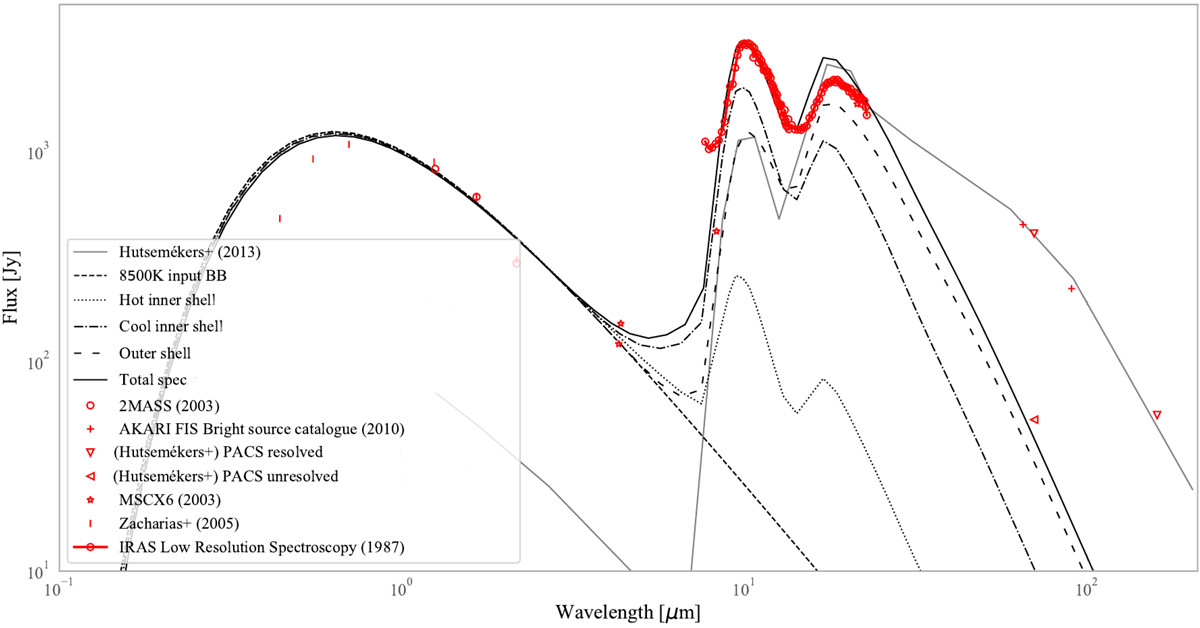
Spectral energy distribution fit to the dereddened photometry gathered from literature (symbols). The dashed line shows the 5 × 10⁵ L⊙, 8500 K black-body (BB) input used for the model. The dotted line is the stellar and hot inner shell emission. The dot-dashed line shows the stellar and cool inner shell emission. The large spacing dashed line shows the outer shell emission contribution. We note that our models did not include the outermost cooler dust shell (18–40″) reported in Hutsemékers et al. (2013), and therefore do not reproduce the far-infrared photometry.
Current usage metrics show cumulative count of Article Views (full-text article views including HTML views, PDF and ePub downloads, according to the available data) and Abstracts Views on Vision4Press platform.
Data correspond to usage on the plateform after 2015. The current usage metrics is available 48-96 hours after online publication and is updated daily on week days.
Initial download of the metrics may take a while.