Fig. 2.
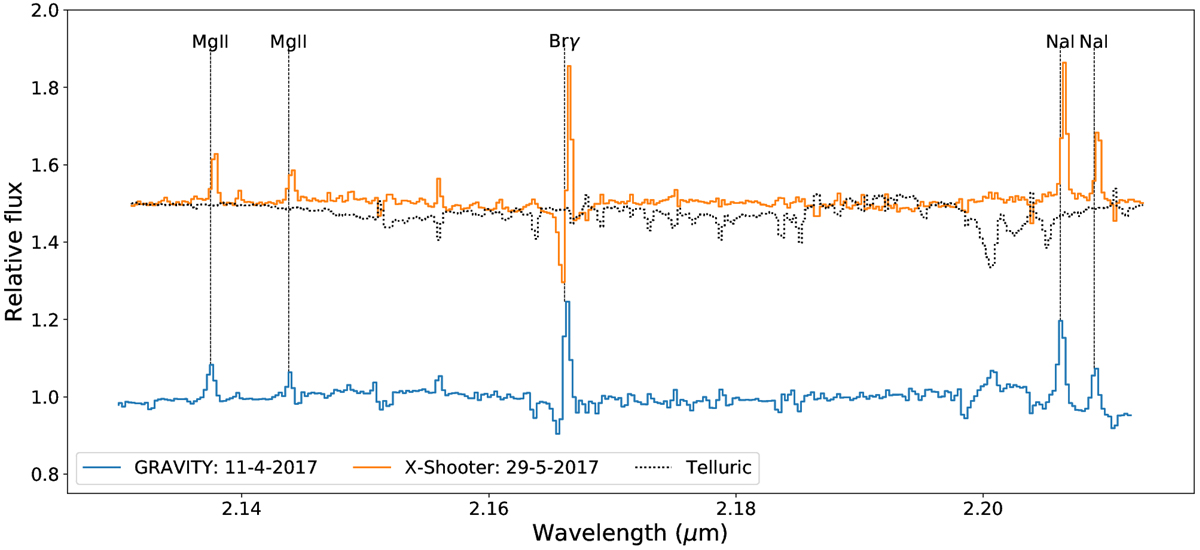
Normalised spectra of IRAS 17163 (GRAVITY and X-shooter) around the 2 μm continuum level. The presented wavelength range contains all the observed Brγ, Na I, and Mg II emission lines. The dotted line represents the normalised telluric absorption spectrum applied to correct the spectrum of the object. The observed difference in line-to-continuum ratio is due to the higher spectral resolution of the X-shooter.
Current usage metrics show cumulative count of Article Views (full-text article views including HTML views, PDF and ePub downloads, according to the available data) and Abstracts Views on Vision4Press platform.
Data correspond to usage on the plateform after 2015. The current usage metrics is available 48-96 hours after online publication and is updated daily on week days.
Initial download of the metrics may take a while.