Fig. 3.
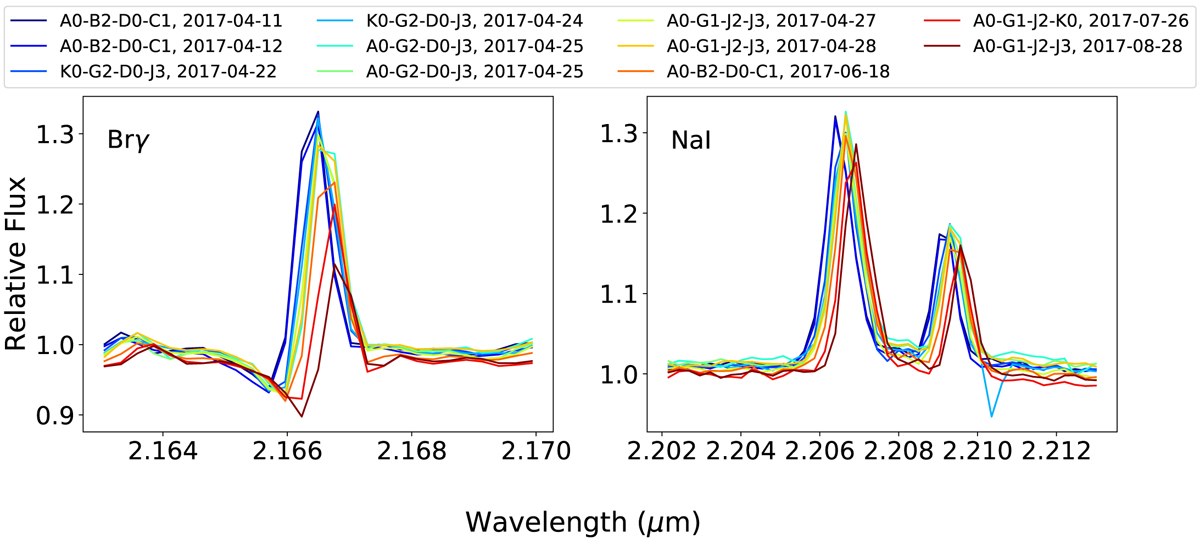
Spectra of the Brγ (left) and Na I doublet (right), normalised to the continuum level, for the different observing dates and configurations in different colours. The dataset shows a gradual drop in the flux of the Brγ emission (up to ∼67%) over the observing period of four months, while Na I emission does not vary significantly.
Current usage metrics show cumulative count of Article Views (full-text article views including HTML views, PDF and ePub downloads, according to the available data) and Abstracts Views on Vision4Press platform.
Data correspond to usage on the plateform after 2015. The current usage metrics is available 48-96 hours after online publication and is updated daily on week days.
Initial download of the metrics may take a while.