Free Access
Fig. 4.
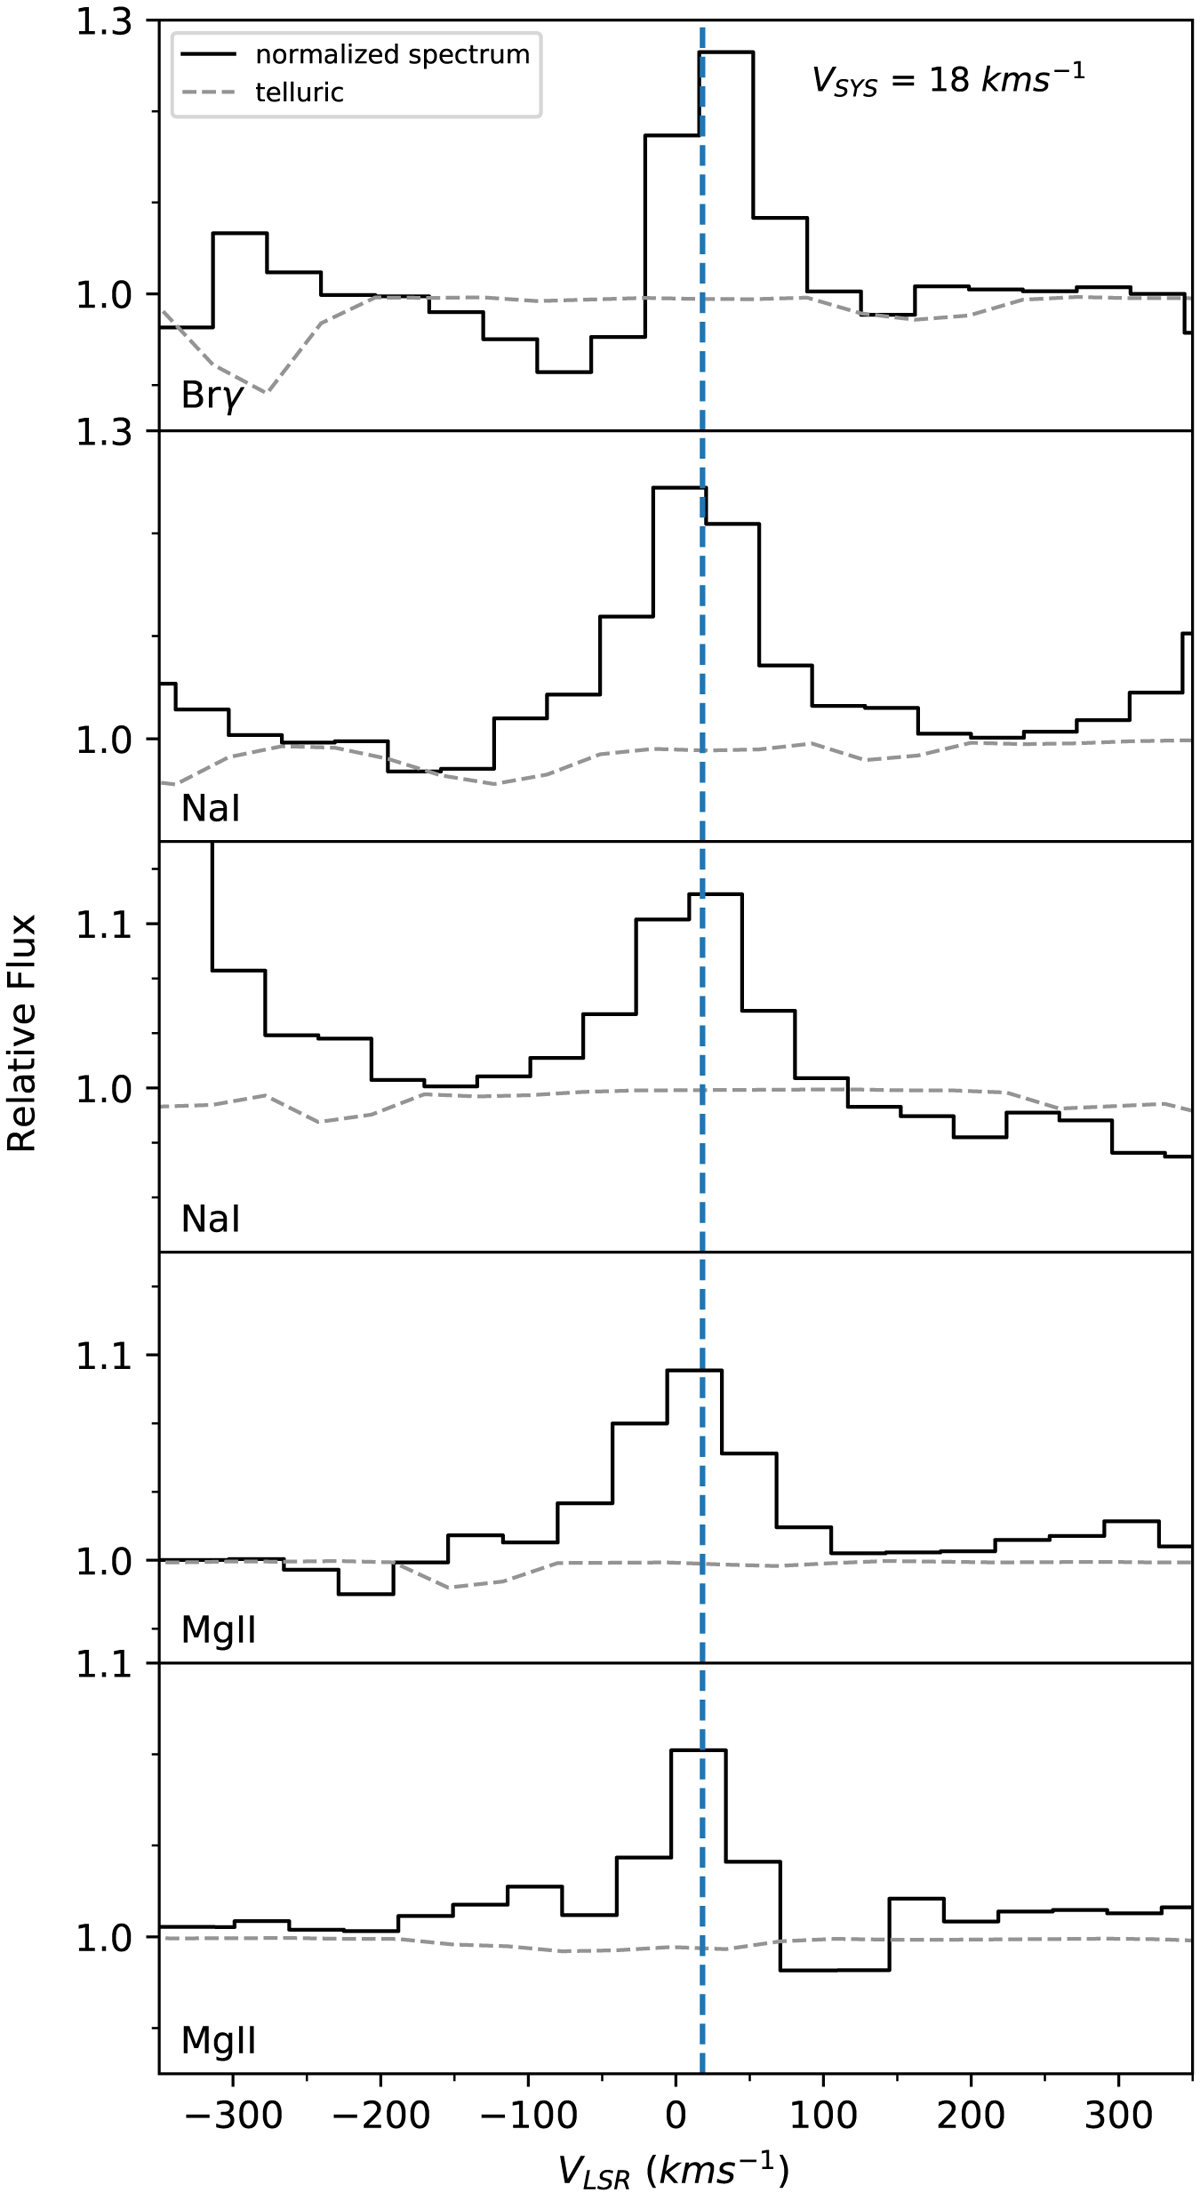
Line profiles of the observed Brγ, Na I, and Mg II emission towards IRAS 17163. The dotted line represents the telluric absorption spectrum applied to correct the spectrum of the object. The vertical line represents the systemic velocity as reported by Wallström et al. (2015) using the optical Fe II emission.
Current usage metrics show cumulative count of Article Views (full-text article views including HTML views, PDF and ePub downloads, according to the available data) and Abstracts Views on Vision4Press platform.
Data correspond to usage on the plateform after 2015. The current usage metrics is available 48-96 hours after online publication and is updated daily on week days.
Initial download of the metrics may take a while.