Fig. 5.
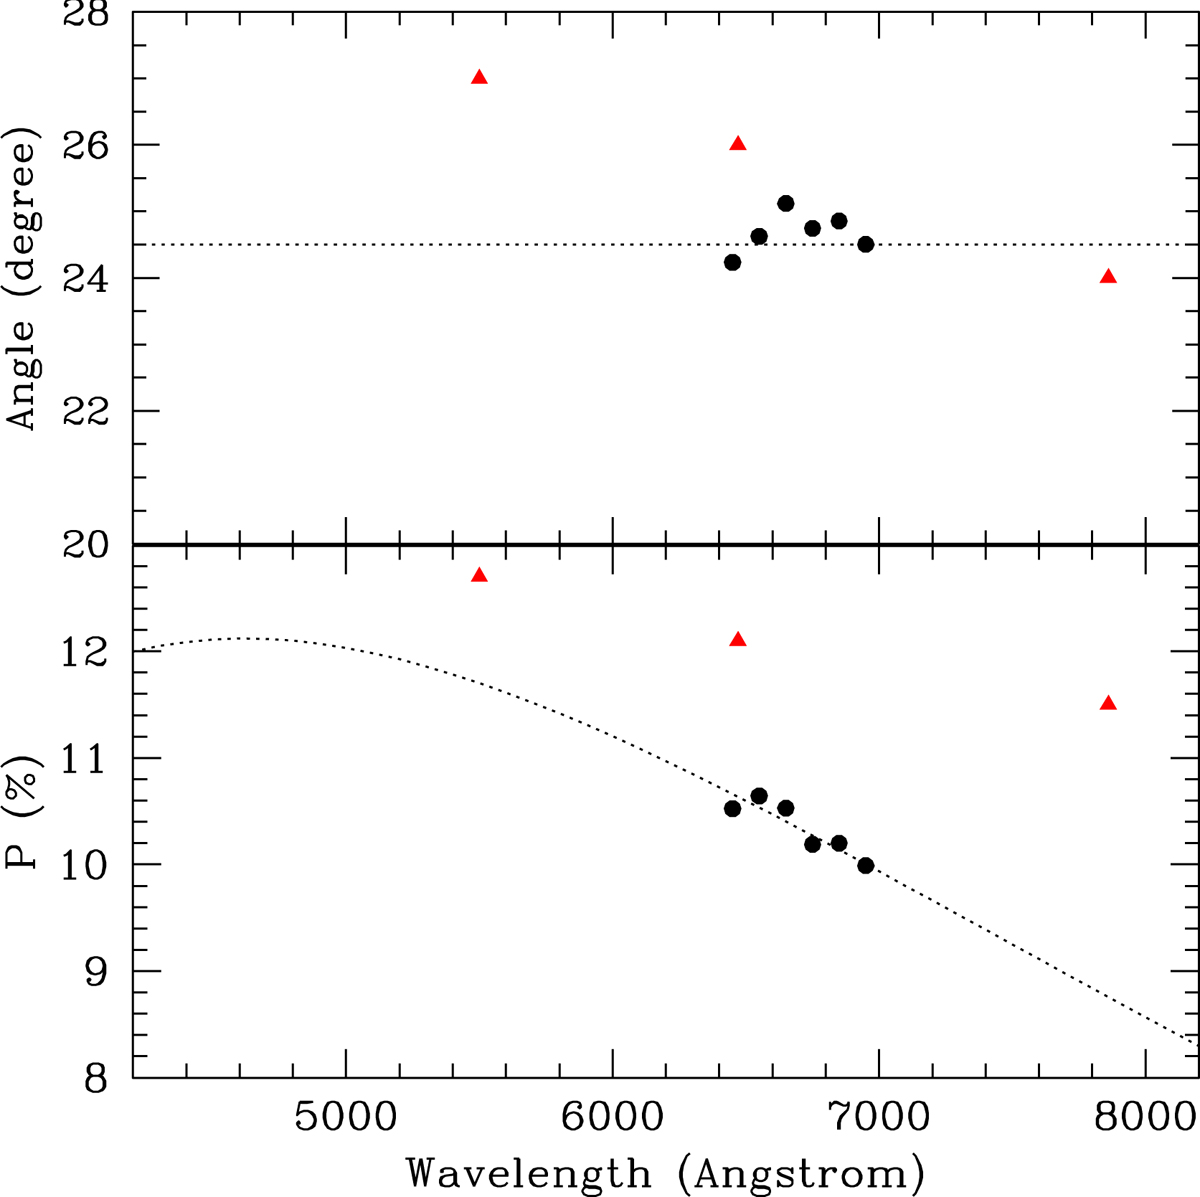
Polarisation (bottom panel) and polarisation angle (top panel) observed towards the Fried Egg Nebula. The black dots represent the broadband values, computed in steps of 10 nm, or 100 Å, from the spectropolarimetric data. The red triangles represent the Lebertre et al. (1989) data. The dashed line is the best-fit Serkowki law for interstellar polarisation.
Current usage metrics show cumulative count of Article Views (full-text article views including HTML views, PDF and ePub downloads, according to the available data) and Abstracts Views on Vision4Press platform.
Data correspond to usage on the plateform after 2015. The current usage metrics is available 48-96 hours after online publication and is updated daily on week days.
Initial download of the metrics may take a while.