Fig. 2.
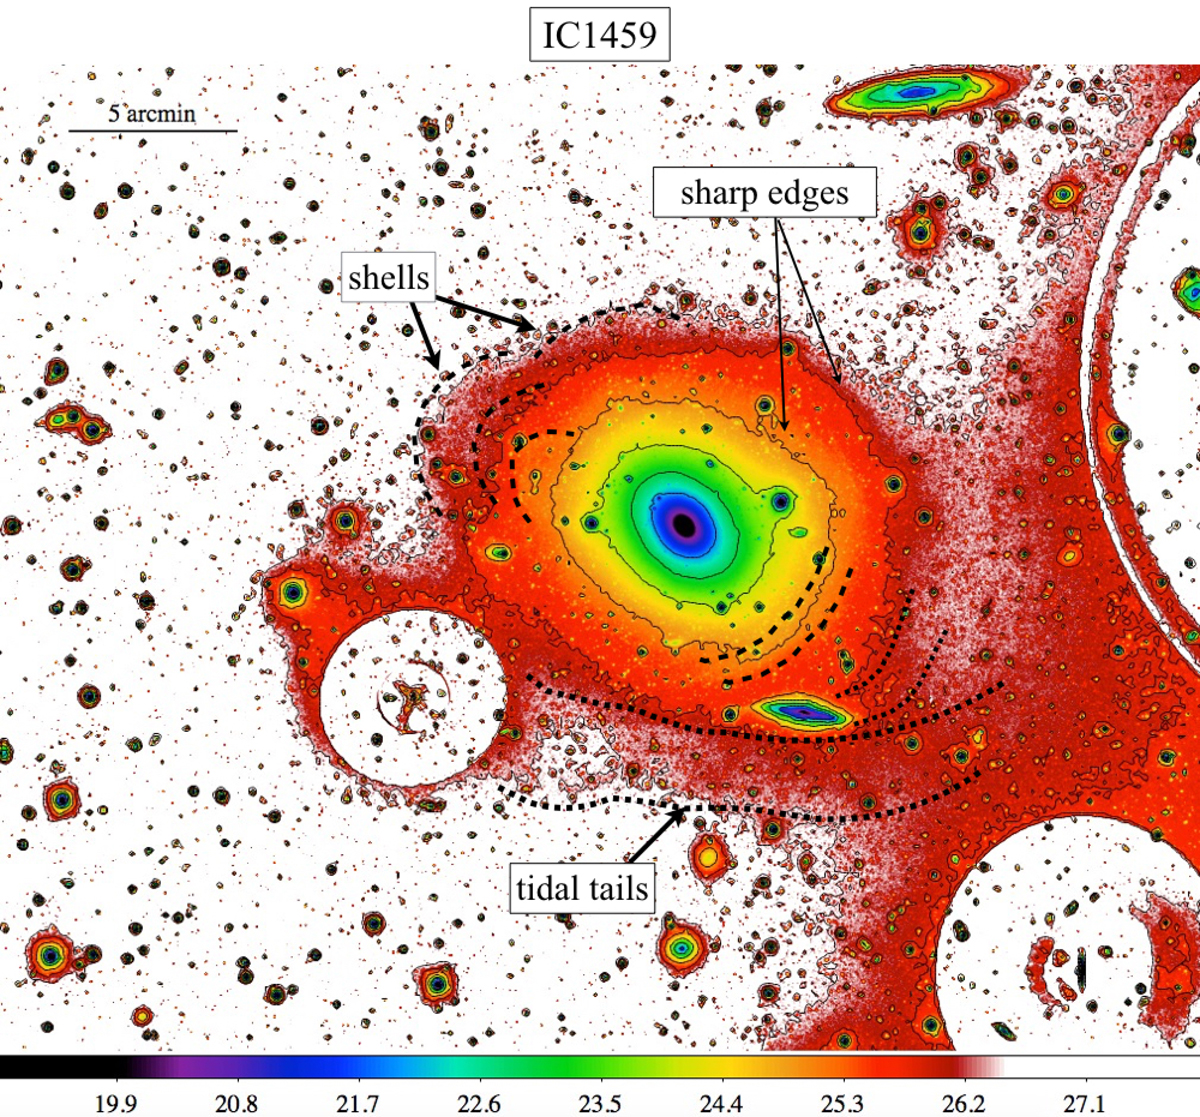
Enlarged region (∼52′×43′) of the VST mosaic around IC 1459 in the g band. The image is in surface brightness levels given in the horizontal colour-bar. The solid contours correspond to the surface brightness levels: 22, 23, 24, 25, 26.4 mag arcsec−2. The main low-surface-brightness features detected in the galaxy outskirts are marked on the image: dotted lines and dashed lines delimit the tidal tails and shells, respectively. The prominent sharp edges on the west side are also indicated with arrows (see text for details).
Current usage metrics show cumulative count of Article Views (full-text article views including HTML views, PDF and ePub downloads, according to the available data) and Abstracts Views on Vision4Press platform.
Data correspond to usage on the plateform after 2015. The current usage metrics is available 48-96 hours after online publication and is updated daily on week days.
Initial download of the metrics may take a while.