Fig. 5.
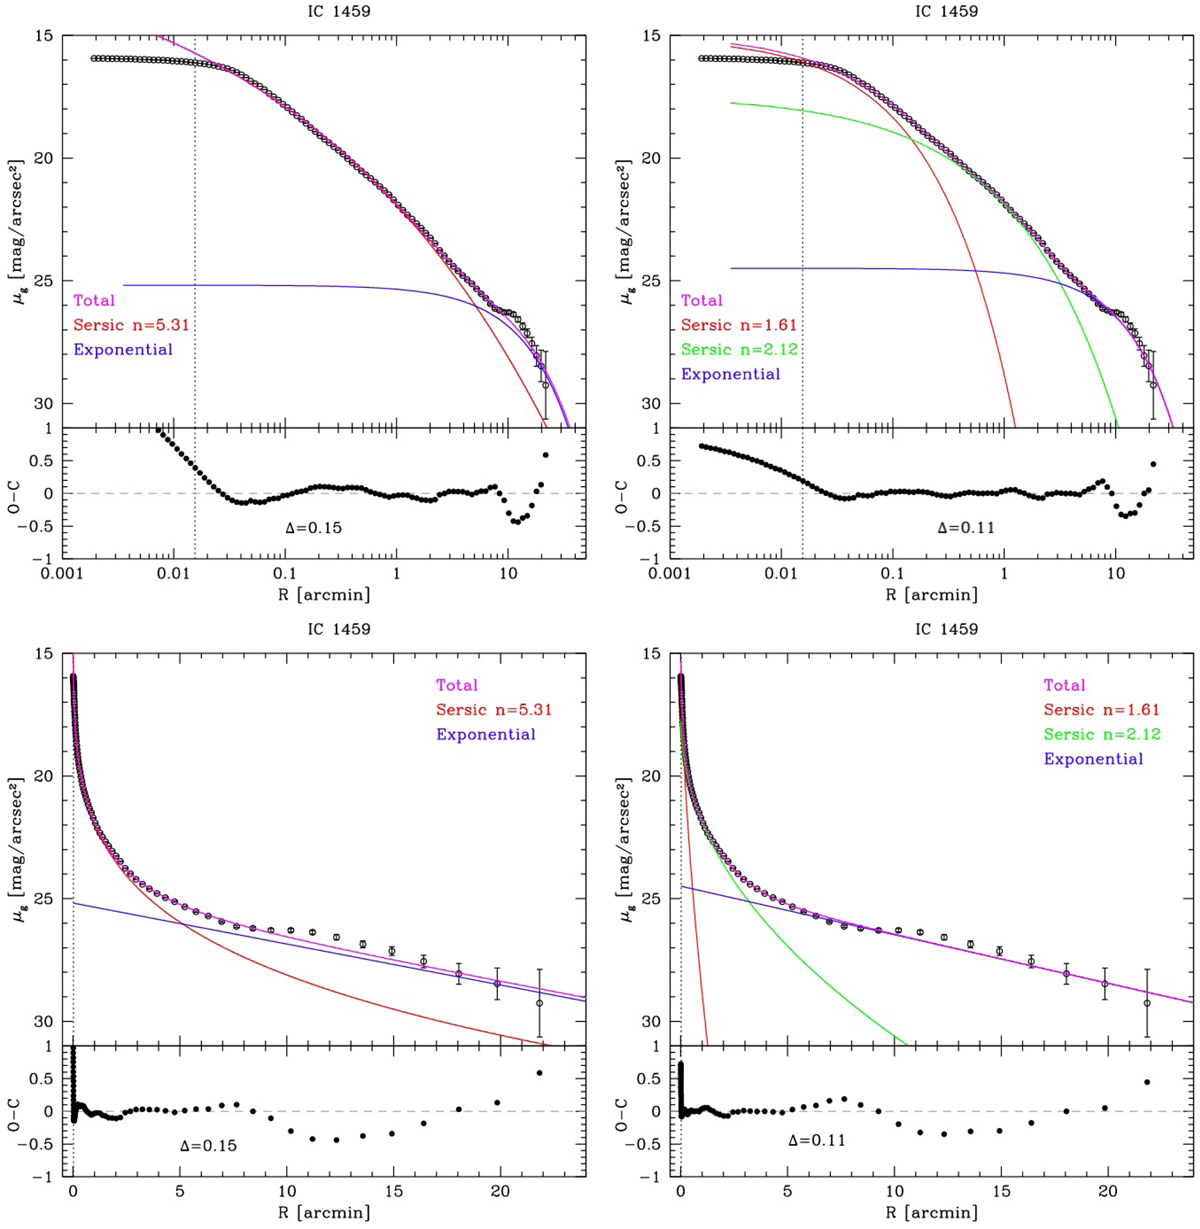
Surface-brightness radial profile of IC 1459 in g band (black open circles) on a logarithmic (top panels) and linear scale (bottom panels) fitted with a two-component model (left panels) and with a three-component model (right panels). The red solid line is the first Sérsic component, the green solid line is the second Sérsic component, the blue solid line is the exponential component, and the magenta solid line marks the model of the total light distribution. The black vertical dotted line marks the core of the galaxy which was excluded in the fit (![]() ). The O − C panel (black filled circles) represents the residual between the azimuthally averaged surface-brightness radial profile and the multi-component model. Δ is the rms scatter minimised by the Levenberg–Marquardt algorithm (Seigar et al. 2007).
). The O − C panel (black filled circles) represents the residual between the azimuthally averaged surface-brightness radial profile and the multi-component model. Δ is the rms scatter minimised by the Levenberg–Marquardt algorithm (Seigar et al. 2007).
Current usage metrics show cumulative count of Article Views (full-text article views including HTML views, PDF and ePub downloads, according to the available data) and Abstracts Views on Vision4Press platform.
Data correspond to usage on the plateform after 2015. The current usage metrics is available 48-96 hours after online publication and is updated daily on week days.
Initial download of the metrics may take a while.