Fig. 7.
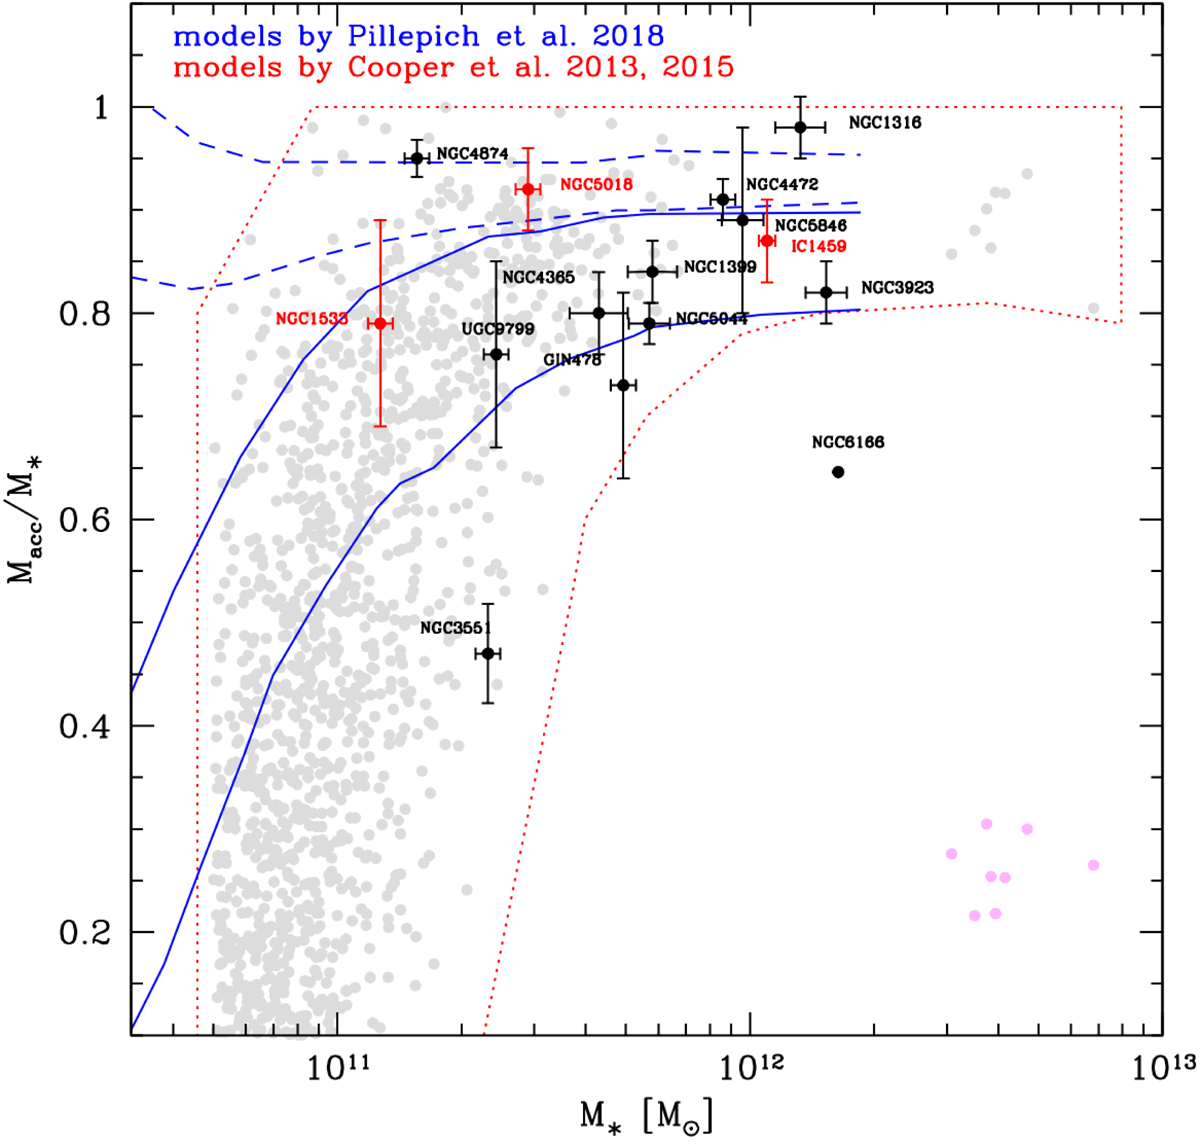
Accreted mass fraction as a function of total stellar mass for ETGs. The measurements for NGC 5018, NGC 1533, and IC 1459 (from the three-components fit) are given as red circles. Black circles correspond to other BGGs/BCGs from the literature (Seigar et al. 2007; Bender et al. 2015; Iodice et al. 2016, 2017b; Spavone et al. 2017b, 2018). The region within the red dashed lines and the grey filled circles corresponds to the predictions of cosmological galaxy formation simulations by Cooper et al. (2013, 2015). The regions brackets by the blue continuous and dashed lines indicate the accreted mass fraction measured in the Illustris simulations by Pillepich et al. (2018, see their Fig. 12) within 30 kpc and outside 100 kpc, respectively. Magenta filled circles show the mass fraction associated with the streams from Table 1 in Cooper et al. (2015).
Current usage metrics show cumulative count of Article Views (full-text article views including HTML views, PDF and ePub downloads, according to the available data) and Abstracts Views on Vision4Press platform.
Data correspond to usage on the plateform after 2015. The current usage metrics is available 48-96 hours after online publication and is updated daily on week days.
Initial download of the metrics may take a while.